


Stock Market Pullback Near 200-Day Not A Given
Stock-Markets / Stock Markets 2010 Aug 07, 2010 - 02:17 AM GMTBy: Chris_Ciovacco

 The bulls lounge was nearly empty when we published Stocks May Surprise By Year-End on July 2, 2010. The S&P 500 was standing at 1,022, bears were out in full force, and talk of a move toward 850 on the S&P 500 was common. As we awake today, the S&P 500 stands 11.50% above the intraday low made on July 2, 2010. With the Dow, NASDAQ, and S&P 500 all above their respective 200-day moving averages (see Hedge Funds Care About 200-Day), the question now becomes should you wait for a bullback before putting any new cash to work?
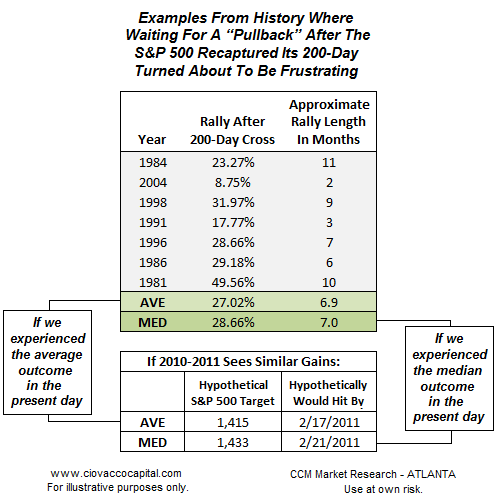
Many investors have been waiting to see what would happen at the 200-day before investing any new cash. The internal voice of investors may now be saying, "The 200-day has been cleared, I need to be patient and wait for a pullback". That approach may or may not turn out to be a good idea, but the history of stock market action after the S&P 500 retakes its 200-day moving average tells us a pullback from current levels is far from a given. A visual inspection of the historical charts shown below can help you better understand the range of possible outcomes when stocks regain their 200-day moving average.
The purpose of this research is not to forecast or predict what stocks may do in the coming weeks, but rather to review historical cases where the S&P 500 Index (”stocks”) continued to surprise on the upside after crossing the 200-day moving average. The pullback approach aligns with the basic instincts of an investor after a big move off an intermediate low. We can find historical periods where the “pullback scenario” would have worked well. However, we were also able to find numerous cases where waiting for a pullback would have proved frustrating (see table below).
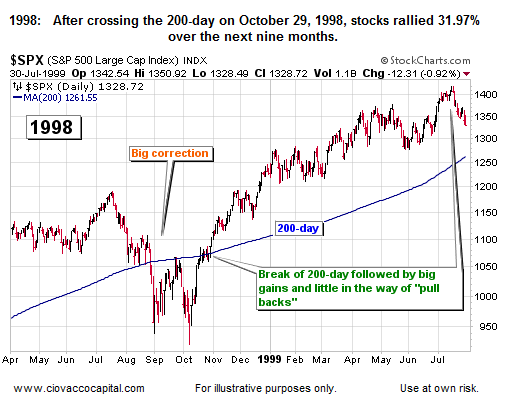
Below, we examine each of the historical cases cited above, including charts showing the market’s moves relative to the 200-day moving average. The first example is taken from 1998. Fundamental concerns of the day included the Russian financial crisis, aftermath of the Asian financial crisis, and falling commodity prices. Following a multi-month correction, stocks moved above their 200-day moving average in October of 1998. Once the 200-day was cleared, stocks continued to move higher with little in the way of buying opportunities. After calls for a new bear market, stocks gained almost 32% in the nine months after the S&P 500 retook its 200-day moving average.
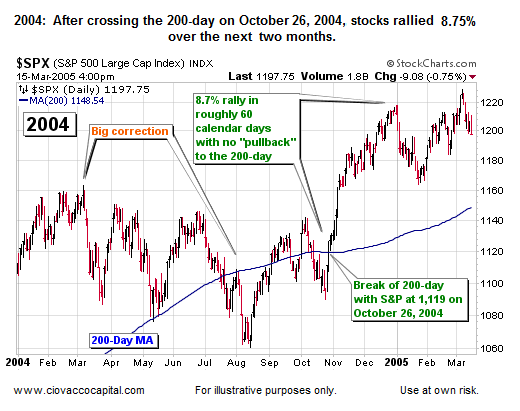
2004 saw similar fundamental concerns to what we have in 2010; questions about the sustainability of an economic recovery, including slowing data relative to job creation, durable goods, and retail sales. After retaking the 200-day in October of 2004, stocks sprinted 8.7% higher in roughly two months with almost no opportunity to buy on a pullback.
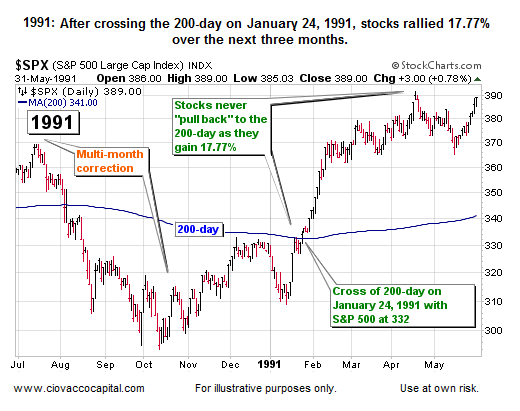
Lingering effects of the savings and loan crisis in 1991 contributed to economic problems in the United States, Canada, the United Kingdom, and Australia. The Gulf War led to a spike in oil prices in 1990, which hurt both consumers and businesses. The period was marked by slow GDP growth, large budget deficits, and high unemployment. Stocks were able to see better days ahead and found a bottom in October of 1990. The S&P 500 crossed its 200-day moving average in late January 1991. Those who waited for a pullback were disappointed as stocks gained almost 18% with little in the way of corrective action after retaking the 200-day moving average.
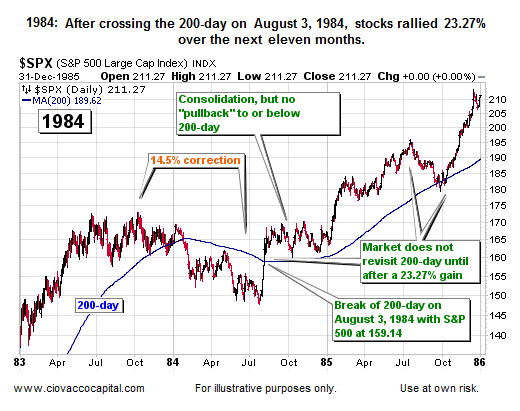
In 1984 Dr. Deming’s “Five Deadly Diseases of American Industry” described a corporate culture that had lost its way, causing a decline in global competitiveness. Unemployment was 8% in January of 1984 and would finish the year at 7.0%.
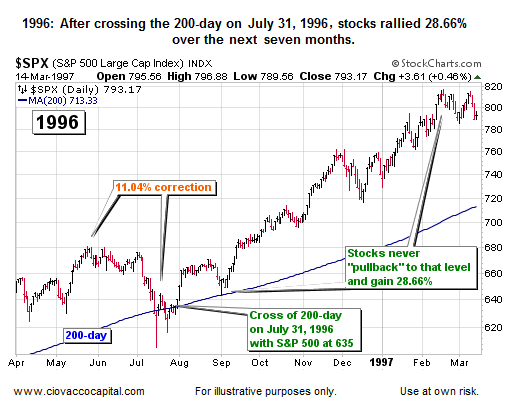
Fears of a recession were high entering 1996 after a stagnant 1995 fourth quarter in terms of economic growth. GDP growth was tame in the first quarter of 1996 coming in at 2.0%. Stocks hit an intermediate peak in May and did not find a bottom until July of 1996. After an 11.04% correction in the S&P 500, the 200-day moving average was recaptured in late July with the Index valued at 635. That level was never revisited as stocks gained almost 29% in the following seven months.
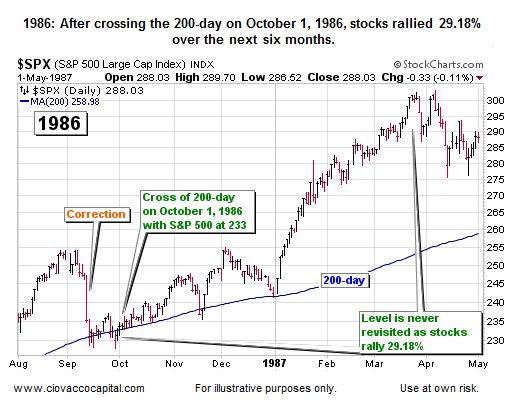
Computers were blamed for much of the stock market volatility in 1986. Declining oil prices helped tame inflation and the Fed was able to lower interest rates. Reduced capital spending by businesses and a decline in exports contributed to slowing, but positive, economic growth. Unemployment stood at 7% for most of the year. Stocks experienced a sharp correction in September of 1986. After finding a bottom, the 200-day was crossed in a bullish manner on October 1, 1986. Stocks remained above the 200-day over the next six months, except for two days, while posting a gain of 29.18%.
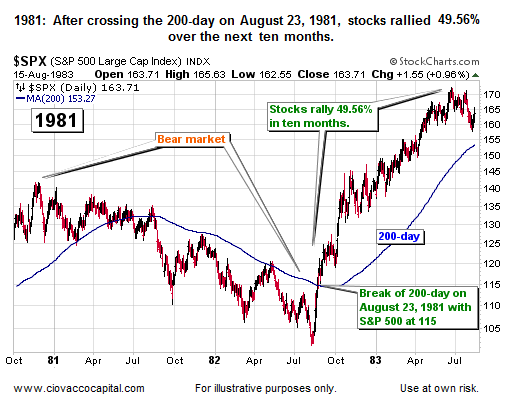
The 1981-1982 case shown below is probably the least similar to present day 2010 since the cross of the 200-day followed a true bear market instead of a correction. However, the sharp move higher after finally breaching the 200-day in July of 1982 does show how market sentiment can change rapidly in a positive manner.
We want to reiterate this analysis is not meant to serve as a forecast of how stocks will perform in the coming weeks. Our purpose is to better understand the real possibility stocks could continue to surprise on the upside should the S&P 500 be able to hold above its 200-day moving average. We also understand and respect the problems of 2010 are quite different from the problems of the historical periods cited above. However, there are also similarities concerning fear of slowing economic growth, recessions, computer dominated stock trading, stubborn unemployment, and a general concern about the competitive standing of the United States in the global arena. In each case, the stock market was resilient and moved higher after completing a corrective process.
Asset markets are ultimately controlled by the actions of human beings. In the financial markets, humans tend to base decisions on either the fear of losses or the fear of missing potential gains. As the market moves further away from the lows, investors’ fears begin to shift from the fear of loss to the fear of missing out on gains (shift is most likely well under way now). While the fundamental problems of the day vary in scope and severity, the human emotion of fear remains a relative constant from economic cycle to economic cycle. Consequently, it can be helpful to understand the full spectrum of history as we formulate investment strategies in the coming weeks and months.
However, it is important we understand how past economic concerns have impacted asset prices. Additional comments can be found in Short Takes.
By Chris Ciovacco
Ciovacco Capital Management
Copyright (C) 2009 Ciovacco Capital Management, LLC All Rights Reserved.
Chris Ciovacco is the Chief Investment Officer for Ciovacco Capital Management, LLC. More on the web at www.ciovaccocapital.com
Ciovacco Capital Management, LLC is an independent money management firm based in Atlanta, Georgia. As a registered investment advisor, CCM helps individual investors, large & small; achieve improved investment results via independent research and globally diversified investment portfolios. Since we are a fee-based firm, our only objective is to help you protect and grow your assets. Our long-term, theme-oriented, buy-and-hold approach allows for portfolio rebalancing from time to time to adjust to new opportunities or changing market conditions. When looking at money managers in Atlanta, take a hard look at CCM.
All material presented herein is believed to be reliable but we cannot attest to its accuracy. Investment recommendations may change and readers are urged to check with their investment counselors and tax advisors before making any investment decisions. Opinions expressed in these reports may change without prior notice. This memorandum is based on information available to the public. No representation is made that it is accurate or complete. This memorandum is not an offer to buy or sell or a solicitation of an offer to buy or sell the securities mentioned. The investments discussed or recommended in this report may be unsuitable for investors depending on their specific investment objectives and financial position. Past performance is not necessarily a guide to future performance. The price or value of the investments to which this report relates, either directly or indirectly, may fall or rise against the interest of investors. All prices and yields contained in this report are subject to change without notice. This information is based on hypothetical assumptions and is intended for illustrative purposes only. THERE ARE NO WARRANTIES, EXPRESSED OR IMPLIED, AS TO ACCURACY, COMPLETENESS, OR RESULTS OBTAINED FROM ANY INFORMATION CONTAINED IN THIS ARTICLE. PAST PERFORMANCE DOES NOT GUARANTEE FUTURE RESULTS.
Chris Ciovacco Archive |
© 2005-2022 http://www.MarketOracle.co.uk - The Market Oracle is a FREE Daily Financial Markets Analysis & Forecasting online publication.