


Four Things To Look For From The Stock Market This Week
Stock-Markets / Stock Markets 2010 Aug 09, 2010 - 12:47 PM GMTBy: David_Grandey

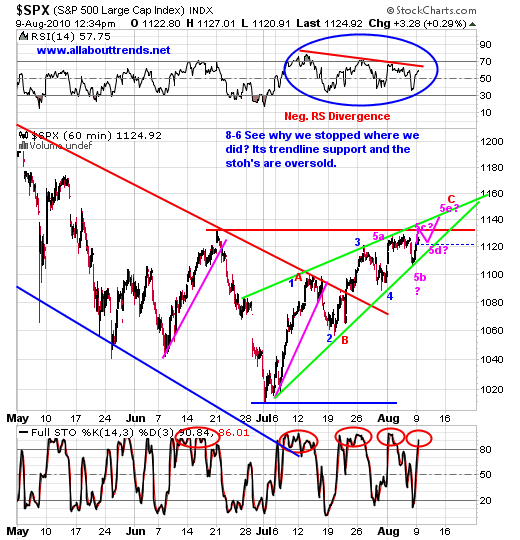
 And the 60 minute charts strike again! Throughout this whole move off the July lows the Full Stoh’s and the green up trendline have basically nailed every peak and valley as shown below in the S&P 500 chart.
There is no doubt that the 60 minute chart and the green line are in play. A break of the green line signals a trend change, while the 1131 level to the upside so far is capping the move higher.
For those not well versed in Elliott Wave nor care to be from here there are 4 things to really watch for:
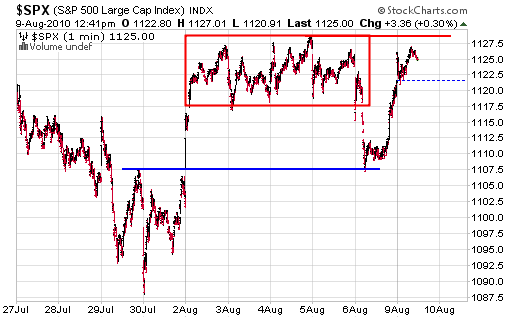
1. Inability to bust thru 1131 to the upside then a break to the downside.
2. There is still the 1140 61.8% fib level hanging out there that MAY or MAY NOT get tagged (60 min chart says it could happen so be aware).
3. The green uptrendline off the July lows. That line has held every pullback. As a result, odds favor when it breaks, it breaks hard.
4. A termination of the GREEN RISING BEARISH WEDGE with a downside break as shown in the 60 minute chart.
So there you have it, this week we’ll be paying attention to these 4 things mentioned above.
For those of you who are into Elliott Wave Theory there is a lot going on in the chart above.
1. You can see the Blue 1,2,3,4 and the pink 5 with us being in the 5th wave.
2. See the pink 5a, 5b, and the potential 5c,5d,5e subdivisions? We say potential as it is just that a potential wave count that could take us to the 1140 61.8 Fibonacci level , assuming we get there.
3 You can also see off of the July lows a RED A and B showing with us in C. This too is a potentuality to consider going into next week.
Bottom line the traditional Technical Analysis backdrop we’ve covered above and the Elliott Wave backdrop are all ending patterns to be aware of. They also signify a trend change is near.
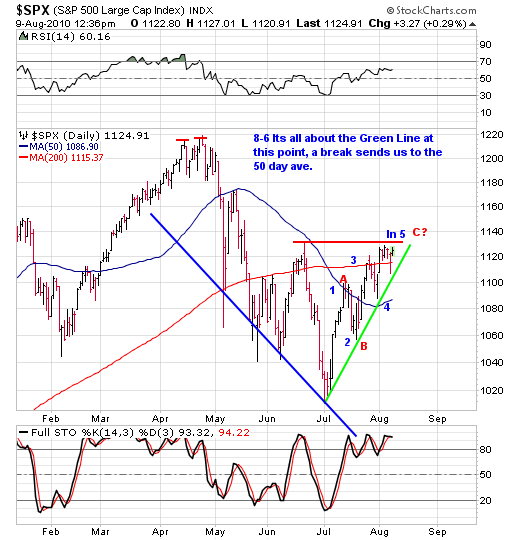
As you can see with the daily charts stohcastically speaking they are still both overbought and have a ways to go to get oversold.
Upon looking at the charts we must say we are impressed by the structure. By that we can’t recall the last time we’ve seen so many confluences all come together at one time. It’s really quite amazing if you ask us.
By David Grandeywww.allabouttrends.net
To learn more, sign up for our free newsletter and receive our free report -- "How To Outperform 90% Of Wall Street With Just $500 A Week."
David Grandey is the founder of All About Trends, an email newsletter service revealing stocks in ideal set-ups offering potential significant short-term gains. A successful canslim-based stock market investor for the past 10 years, he has worked for Meriwest Credit Union Silicon Valley Bank, helping to establish brand awareness and credibility through feature editorial coverage in leading national and local news media.
© 2010 Copyright David Grandey- All Rights Reserved Disclaimer: The above is a matter of opinion provided for general information purposes only and is not intended as investment advice. Information and analysis above are derived from sources and utilising methods believed to be reliable, but we cannot accept responsibility for any losses you may incur as a result of this analysis. Individuals should consult with their personal financial advisors.
© 2005-2022 http://www.MarketOracle.co.uk - The Market Oracle is a FREE Daily Financial Markets Analysis & Forecasting online publication.