


Graham Summers’ Weekly Stock Market SPX Forecast
Stock-Markets / Stock Markets 2010 Aug 10, 2010 - 12:41 PM GMTBy: Graham_Summers

 Since the July bottom, stocks have formed a bearish rising wedge pattern. If you’re unfamiliar with this pattern, it occurs when you have a security that gradually trades higher within an ever-tightening range between two trend lines.
In order for this pattern to be valid, the trend lines have to be validated by multiple touches. As you can see with this latest bearish rising wedge, the trend lines have both been validated by the market bouncing off of them multiple times, telling us that investors consider these lines highly relevant.
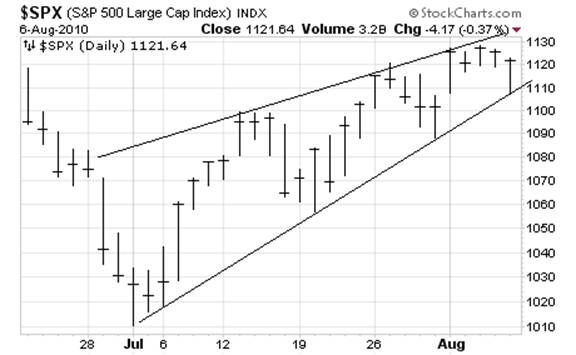
Now, bearish rising wedge patterns are considered “termination” patterns or patterns that occur during the formation of significant tops. This is because once the pattern breaks the security usually returns to the base of the pattern relatively quickly. This means that when this current pattern breaks, we should see the S&P 500 back at 1,010 without much delay.
The issue now is determining whether or not the pattern is complete. Judging from the trend lines and Friday’s action, we’re not quite there yet.
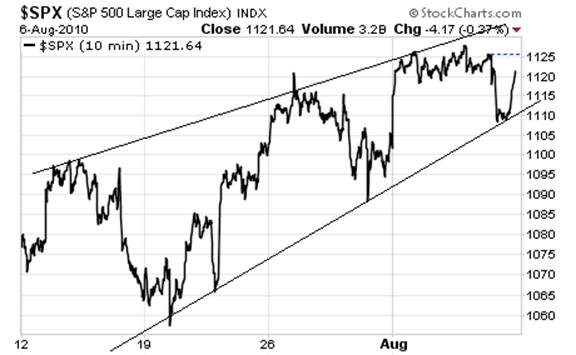
As you can see in the below chart, Friday’s collapse brought stocks right down to the bottom trend line. Had we broken below the trend line, especially on a closing basis, it would be clear we were on the way down again in a major way.
However, rather than doing this, the trend line served yet again as key support and stocks rallied hard from this level into the close, which means the pattern remains “in play.”
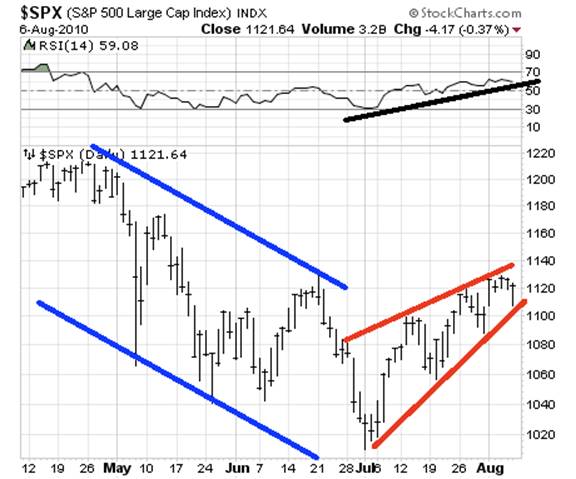
This leaves us with the potential for another, final push higher to test the upper trend line around 1,140 or so. This would coincide with a trend line forming in the S&P 500’s Relative Strength Index (RSI), which should pass into overbought territory (70+) right around the time a final push would bring this pattern to completion.
I’ve drawn in the trend line for RSI, as well as the trend lines for the bearish rising wedge on the chart below. I’ve also included the downward trading channel stocks formed during the initial leg down for the collapse begun at the end of April (the collapse for which this latest rally is the correction or “bounce”).
You may be asking, do stocks need to rise to the upper trend line (1,140)
The short answer is NO.
We could see what’s called a “truncated” final push higher. This occurs when the final push is weak and doesn’t quite make it to the upper trend line because the bulls simply don’t have the energy.
This is actually quite common during corrective rallies like the one we are currently experiencing. And it would greatly add to the bearish case for the market today as it would indicate that the bulls couldn’t even rally the market to the expected level dictated by the pattern the market is following (and which every technical analyst/ trader is aware of).
However, I think the odds favor a final push higher. Traders are actively anticipating the announcement of QE 2 at the Fed’s FOMC meeting this Wednesday. Given that stocks tend to rally into these meetings, as well as the fact that the US economy is clearly heading into another recession (in the context of a Depression, no less), it seems likely to me that the majority of portfolio managers and traders will gun the market early this week (Monday-Tuesday) in anticipation of QE 2, which would allow the market to complete the bearish rising wedge pattern, break into “overbought” status, and be ripe for a significant top around mid-week.
The Fed’s actions are of course game changers and the announcement of QE2 could potentially kick off yet another rally on top of this one started early July. However, if QE 2 is NOT announced, then stocks will have completed a bearish pattern, become overbought, and be ripe for the collapse to 1,010 (at the minimum) that the rising wedge is predicting on the S&P 500.
I cannot pretend to know what the Fed will do, but given the approaching election and the political backlash additional monetization would cause, the announcement of QE 2 seems unlikely at this point.
After all, the Fed has clearly stated that it views the stock market as the key gauge for economic health in the US. As I write this, stocks are only 8% off their one year high. If the Fed cannot stomach an 8% slide in stocks after a 60+% rally over the course of 13 months, then the financial world is in major and I mean MAJOR trouble.
Indeed, for the Fed to announce QE 2 now would signal not only that QE 1 failed, but that they have lost control of the markets and we are heading for a time of high systemic risk even greater than Autumn 2008.
Remember, the only thing propping the market up from March 2009 onward was the view that the Fed could pull us from the brink.
For the Fed to announce QE 2 now, when the market is still 68% up from the March 2009 lows, would destroy any faith the financial world has in the Fed (personally I never had any faith at all, but that’s a different story). This in turn would mean the market breaking to levels that would make 1,010 on the S&P 500 look absolutely heavenly… or the Dollar imploding, pushing the market higher in nominal terms, but at the cost of a dramatic collapse in the real purchasing power of stocks.
So I think the odds favor no announcement of QE 2 on Wednesday and “the next leg down” beginning for stocks around that time. At least that’s the roadmap I’m following right now.
Good Investing!
Graham Summers
PS. If you’re worried about the future of the stock market, I highly suggest you download my FREE Special Report detailing SEVERAL investments that could shelter your portfolio from any future collapse. Pick up your FREE copy of The Financial Crisis “Round Two” Survival Kit, today at: http://www.gainspainscapital.com/MARKETING/roundtwo.html
Graham Summers: Graham is Senior Market Strategist at OmniSans Research. He is co-editor of Gain, Pains, and Capital, OmniSans Research’s FREE daily e-letter covering the equity, commodity, currency, and real estate markets.
Graham also writes Private Wealth Advisory, a monthly investment advisory focusing on the most lucrative investment opportunities the financial markets have to offer. Graham understands the big picture from both a macro-economic and capital in/outflow perspective. He translates his understanding into finding trends and undervalued investment opportunities months before the markets catch on: the Private Wealth Advisory portfolio has outperformed the S&P 500 three of the last five years, including a 7% return in 2008 vs. a 37% loss for the S&P 500.
Previously, Graham worked as a Senior Financial Analyst covering global markets for several investment firms in the Mid-Atlantic region. He’s lived and performed research in Europe, Asia, the Middle East, and the United States.
© 2010 Copyright Graham Summers - All Rights Reserved
Disclaimer: The above is a matter of opinion provided for general information purposes only and is not intended as investment advice. Information and analysis above are derived from sources and utilising methods believed to be reliable, but we cannot accept responsibility for any losses you may incur as a result of this analysis. Individuals should consult with their personal financial advisors.
Graham Summers Archive |
© 2005-2022 http://www.MarketOracle.co.uk - The Market Oracle is a FREE Daily Financial Markets Analysis & Forecasting online publication.