Japanese Style Deflation Fear Strikes Global Bond Markets
Interest-Rates / Deflation Aug 12, 2010 - 09:33 AM GMTBy: Gary_Dorsch
 The US-economy has not experienced sustained deflation since the Great Depression of the 1930’s, when consumer prices fell 10% between 1929 and 1933. But Japan has been battling falling prices since 1995, – triggered by the bursting of the Nikkei-225 equity bubble, and a unrelenting slide in land prices. Central bankers and macro-economists from all corners of the earth have been studying Japan’s descent from its giddy economic prosperity in the 1980’s, and into the deflation trap in the 1990’s, that Tokyo’s financial warlords have still been unable to remedy.
Nowadays, central bankers must be watchful, - not only against the traditional worry of inflation, but also to defend against the devil of deflation, - well before inflation dwindles to zero-percent. That’s because deflation is more debilitating to economies - and harder to overcome - than inflation. In Australia, Brazil, China, Chile, Israel, India, and Peru, central bankers have tightened their monetary policies this year to control inflation. However, in England, Japan, and the United States, and to a lesser degree in the Euro-zone, central bankers are engaging in the radical scheme of “Quantitative Easing,” (QE), in order to fend-off the threat of deflation.
Recently, several Federal Reserve officials have been openly expressing their fears that the US-economy could stumble into a Japanese style deflation trap. And as Japan’s experience suggests, deflation can increase the financial pain of a traditional recession. When deflation strikes, lower sales prices cut into business profits and in turn, prompts companies to trim payrolls. That undermines consumers’ buying power, leading to a vicious cycle of more pressure on profits, jobs, and wages, - and cutbacks in purchases of new equipment.
Worse yet, if deflationary psychology begins to take hold among consumers, they’ll often wait for still lower prices, before buying, and adding to the deflationary trend. All these factors feed on one another, setting off a downward price spiral. Fed chief Ben Bernanke figures the central bank has the tools to stop a deflationary spiral, - namely – a technology called an electronic printing press. “Sufficient injections of money will ultimately always reverse a deflation,” Bernanke said in 2002.
Japanese style Deflation, - post Nikkei225 Bubble
Since the Fed formally adopted the radical QE-scheme, - injecting $1.75-trillion into the coffers of the Wall Street Oligarchs, through the purchases of mortgage securities and Treasury notes, traders have been debating whether this super easy money policy would lay the groundwork for higher inflation, or rather simply act to prevent a deflationary spiral, that could deepen an economic slump.
 So far, the massive QE liquidity injections supplied by the Fed, the Bank of England, and Bank of Japan, have been mostly channeled into high grade corporate and junk bonds, and municipal and federal government bonds. The tidal wave of liquidity has pushed shorter term 5-year note yields in England, Japan, Germany, and the US-credit markets, to all-time or multi-decade lows, - indicating that the scales of market mania are tipping in favor of Japanese style deflation.
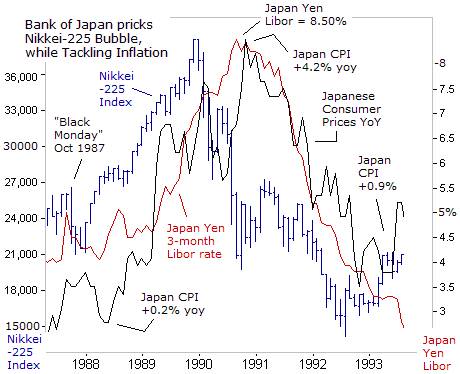
For the past two-decades, Japanese fixed income investors, - controlling 16-Trillion yen of savings, have been forced to accept ultra-low interest rates for their safe money. It’s hard to believe that 20-years ago, Japanese yen Libor deposits were offered at interest rates of 8.50-percent. Today, 3-month yen Libor rates are pegged at 0.25%, and haven’t yielded more that 1% for the past 15-years. Will American fixed income investors face the same nightmare of ultra-low interest rates, spurred by Japanese style deflation in the decade ahead?
Japan’s nightmare with deflation originates with the spectacular rise and fall of the Nikkei-225 bubble between 1986 and 1992. During the boom years, through the end of 1989, the Bank of Japan (BoJ) conducted an easy money policy, designed to offset the deflationary impact of a soaring yen. The US-dollar had plunged from 251-yen at year-end 1984, to as low as 122-yen at year-end 1987. The BoJ pegged its discount rate at 2.50% from February 1987 until May 1989.
Japan’s trade surplus, had grown from $56-billion in 1985, to a peak of $96-billion in 1987, before its declined because of the yen’s rapid appreciation to $64-billion in 1990. The BoJ allowed the M2 money supply to grow at more than +10% /year, much faster than its economy which grew between +4.8% and +5.9% between 1987 and 1989, in order to slow the yen’s surge against the US-dollar.
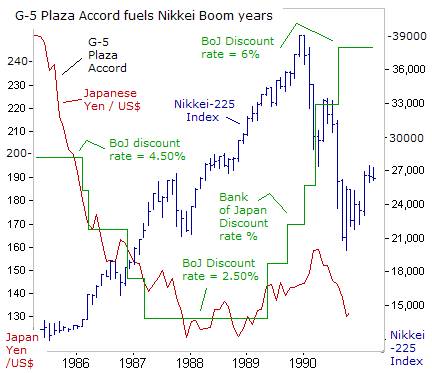 The Tokyo Stock Exchange (TSE) indexes responded with a powerful rally. Even the “Black Monday” stock market crash on Wall Street, in October 1987, couldn’t dent the wild enthusiasm for Tokyo shares. During the stock market boom of the late 1980’s, the TSE surpassed the value of the NYSE to become the world’s largest. The TSE’s market value peaked at $4.26-trillion at the end of 1989, compared to $2.9-trillion for the NYSE. However, by the end of 1991, the TSE’s market value had declined to $3-trillion, compared to the NYSE’s $3.7-trillion.
The Japanese bubble economy was not limited to the stock market. Sharp price rises were also seen in real estate markets, beginning in 1986, where prices more than doubled in four-years. Prices were highest in Tokyo’s Ginza district in 1989, with choice properties fetching over 100-million yen ($1-million) per square meter ($93,000 per square foot). The BOJ finally began to act against the land and share price bubbles, when it hiked the official discount rate in May-1989, the first hike in nine-years, from 2.50% to 3.25 percent.
Despite the rate hike, the Nikkei continued to climb to new record highs. By the end of August-1989, the Nikkei-225 had topped 35,000, and continued in this range through October-1989, when the BOJ raised the discount rate again to 3.75%, following rate hikes by the Bundesbank and other central banks. Ten-year JGB yields rose 175-basis points over sixteen months to 6.75% in November-1989.
But the Tokyo stock markets ended 1989 on a buoyant note, with unemployment falling to a historic low of 2.3% during the fall of 1989. The Nikkei-225 index closed at 38,970 in Dec-1989, and appeared poised to soon hit the psychological 40,000-level. However, inflation was also racing ahead, rising sharply from a miniscule +0.2% in March 1988, to as high as +4.2% in April 1990.
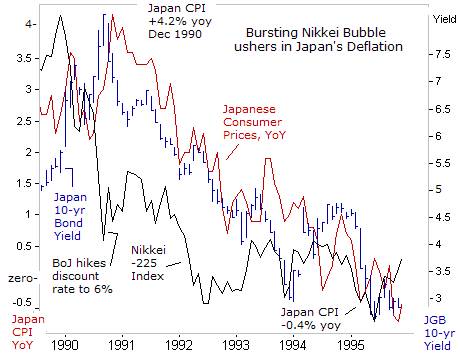
Then without warning, the Nikkei-255 index began to break sharply in late January-1990, when it fell 5% in three-days. The event was attributed to index arbitrage rather than market fundamentals. In February-1990, the Nikkei suddenly fell 4% in three-days. Financial journalists noted the slide, but couldn’t offer an explanation. Yet the Bank of Japan (BoJ) continued to slam on the monetary brakes. In March 1990, the BoJ lifted the discount rate 100-basis points to 5.25%, and 75-bps higher to 6.00% in August 1990, aiming to topple the bogeyman of inflation.
The BoJ guided the 3-month yen Libor rate sharply higher to 8.50%, focused on combating speculation in real estate, while acting oblivious to the meltdown in the Nikkei-225 index. The Iraqi invasion of Kuwait on August 2, 1990 triggered an 11% plunge for the Nikkei in a single day. A few days later, the BOJ slammed the nails into the coffin of the Nikkei-225 index, by hiking its discount rate 75-bps to 6%, - tightening its monetary policy to the extreme point of overkill.
The last two BoJ rate hikes, precipitated a major contraction of Japan’s M2 money supply from a +12% growth rate in early-1990 to around +2% during most of 1991, 1992, and 1993. This acute M2 contraction contributed to the collapse of the equity market in Japan. The Nikkei index tumbled almost 50% over the next ten-months, skidding to 20,000 in October 1990, and dropping to 15,000 in 1992.
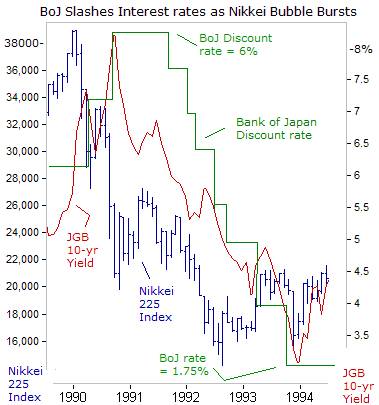 Japan’s equity bubble burst rather than deflated. The share price collapse of 1990 presaged a severe economic downturn, which hit Japan in the spring of 1991, and created huge upheavals in the banking system. The BoJ belatedly began to reverse course, signaled by its decision in July-1991 to lower the discount rate a half-point to 5.5-percent. Then followed a series of rate-cuts, to as low as 3.25% in July 1992. In February-1993, the BOJ lowered the rate to 2.5%, and in Sept-1993 it fell to 1.75%, the lowest discount rate ever reached since the BoJ was founded in 1883.
Despite these efforts, Japan’s M2 money supply fell close to zero growth at one point in 1992 and growth rates continued far below the figures typical during the bubble period. Japan’s 10-year government bond (JGB) yield, which hit an all-time high of 8.25% in Sept 1990, would begin a historic slide, skidding to around 3.25% in Dec-1993, and eventually hitting a record low of 0.43% a decade later.
The BoJ continued a long campaign of interest rate cuts – driving the overnight call-money rate to zero-percent by 1999. But Japan’s economy never recovered. The BoJ had waited almost 3-years after entering deflation before beginning QE. Many central bankers hold the view that Japanese authorities failed to lower interest rates quickly enough to insure the money supply kept growing after the bubbles had burst.
Japanese policymakers did not anticipate the deflationary slump and did not take out sufficient insurance to protect against downside risks through a precautionary further loosening of monetary policy. A Federal Reserve econometric simulation of the global economy shows that had the Bank of Japan cut short-term interest rates by a further 200-basis points at any time between 1991 and early 1995, deflation could have been avoided. However, the window of opportunity closed in the second quarter of 1995. By then, inflation had already fallen below zero.
Finally, confronted with a deflationary crisis, the BoJ pumped-up the monetary base by more than 10% in late 1995 and early 1996. The reacceleration of money growth coupled with massive fiscal stimulus from higher public works spending led to a sharp recovery in Japanese growth rate in late 1995 and 1996. The move toward deflation was stopped, but ominously, land prices in Japan continued to fall; by 1996 they had sunk to about half their level at the peak of the bubble.
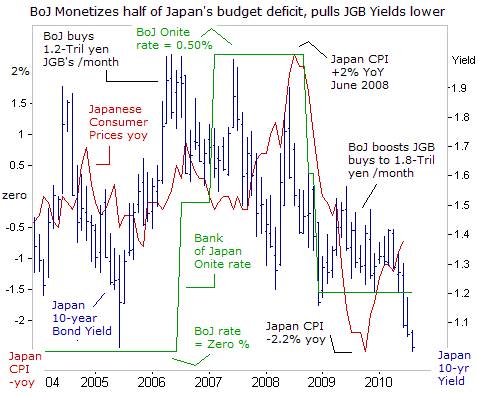 Fortunately for Japan, rather than suffering a deep and destructive downward spiral, Japan’s deflation has been surprisingly mild. Consumer prices have been mostly flat or falling in Japan for 15-years, but deflation has never been more than -2.2% in any single year. In fact, in March 2006, the BoJ actually had the courage to scrap its five-year QE-policy of flooding the banking system with excess cash, reflecting its confidence that a seven-year battle against deflation has been won.
Former BoJ chief Toshihiko Fukui dreamt of normalizing Japan’s monetary policy since he took the job in 2003. He finally got his wish, scrapping “quantitative easing” (QE), “because sticking to it when the economy is heating up could spur inflation and create bubbles in property and stock markets,” he warned. The Japanese economy grew at an annualized pace of +5.5% in the fourth quarter of 2005, and the Nikkei-225 was in the midst of an impressive rally to the 18,000-level.
Still, Fukui relented to heavy political pressure, by vowing that “Interest rates will stay at zero for a while, before being adjusted according to economic conditions.” Japan’s 10-year bond yield, which had hit a historic low of 0.43% in June 2003, began to climb higher towards 2%, after the BoJ drained 35-trillion yen out of the Tokyo money markets. The rise in JGB yield drew loud protest form Tokyo’s financial warlords. Japan’s Chief Cabinet Secretary Shinzo Abe warned the BoJ to keep its “overnight interest rate close to zero percent,” because a 1% rise in long-term rates would raise debt servicing costs by 1.6-trillion yen ($13.5-billion).
Fast forwarding to today, Japan’s 10-year yield has tumbled to the psychological 1% level, down from 1.40% three months ago. Most remarkably, JGB yields are tumbling to historic lows, even though Japan is the second most heavily indebted industrialized country in the world. Japan’s $8.73-trillion of debt is almost double its $4.9-trillion in annual gross domestic product. And its budget deficit is projected to swell to 57.3-trillion yen ($610-billion) in the year starting April 2011. Yet the massive increase in supply hasn’t stopped the sharp slide in JGB yields.
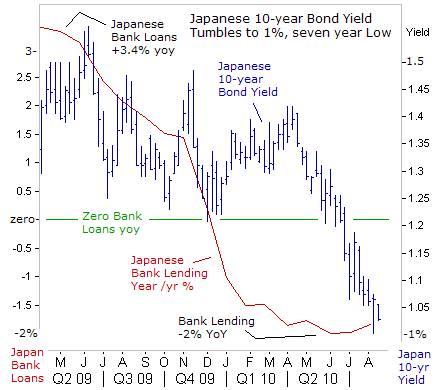 Instead, JGB’s are supported by strong demand from domestic banks that are flush with yen due to sluggish appetite for new loans. Also, the Bank of Japan buys 1.8-trillion yen of JGB’s each month, monetizing half of the government’s budget deficit this year. The BoJ is trying to counter a shaky economic recovery at home, stymied by deflation and a strong yen. The US-dollar’s slide towards 85-yen, a 14-year low, is squeezing Japanese exporter profits, adding to deflationary price pressures, and pinning the Nikkei-225 in the mid-9,000 range.
US Banks hoard Treasuries, shun new Loans
In the US, the Treasury’s 2-year yield has tumbled to 50-basis points, the lowest in history, and is now only 36-basis points higher in yield than Japan’s 2-year note. The Fed’s propaganda artists have succeeded in whipping-up paranoia of Japanese style deflation spreading to the US-economy. But the historic slide in Treasury yields is also supported by the stubbornly high number of unemployed, discouraged or involuntarily part-time US-workers, that now totals more than 25-million, or 16.5% of the labor force, - equaling one in six Americans. There are approximately five unemployed workers for every available opening.
“Boosting credit to struggling small businesses is vital to keep the US recovery on track,” said Fed chief Bernanke on July 12th. But total loans held by commercial banks dropped 5% last year and lending has continued to shrink in 2010. The scarcity of credit for small and medium-sized businesses, traditionally the driving-force behind job creation, has been blamed for woes ranging from a 16.5% jobless and under-employment rate to the perceived risk of “double-dip” recession.
Ten-year US note yields dropped to a 15-month low of 2.69% on August 11th, after the Fed said it would reinvest the proceeds from its maturing mortgage-backed bonds, into Treasury bonds. The 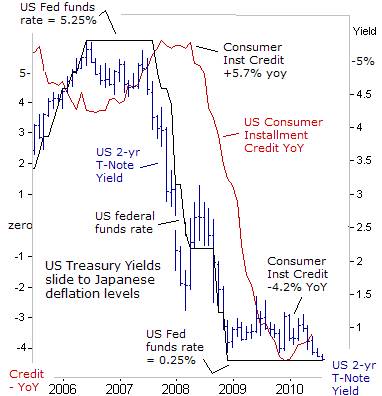 Fed aims to drive the prices of Treasury notes higher, and knock their yields lower, so they’re no longer attractive investments, and thus lure traders into buying riskier corporate bonds and stocks.
US bond traders are ruling out the possibility of a Fed rate hike, until the second half of 2011, at the earliest. After-all, the BoJ fought deflation with QE for five-years, before it had the courage to lift its overnight loan rate above zero-percent. Once the financial crisis hit world markets, triggered by the collapse of Lehman Bros, the BoJ quickly lowered the overnight rate by 40-bps to 0.10-percent.
US-consumers are deleveraging, - paying off debts and further reinforcing a slowing of consumption. That’s a process that could last for years, especially if companies continue to slash wages. There’s been a virtual “double dip” recession in the US housing market. The homebuyer tax credit expired at the end of April, and sales of new and existing homes have collapsed, with new home sales plunging 33% in May. Housing starts have collapsed as well, dropping at a -44% annual rate.
Despite the anxiety over record budget deficits, the US Treasury sold $74-billion of government bonds this week, at sharply lower interest rates. The US budget deficit is projected to surpass $1.4-trillion for a second consecutive year, yet the bond market is less concerned with government spending that’s out of control, and more worried about the prospect of Japanese style deflation. The sale of $24-billion of 10-year T-notes was the strongest of any such auction since 1993.
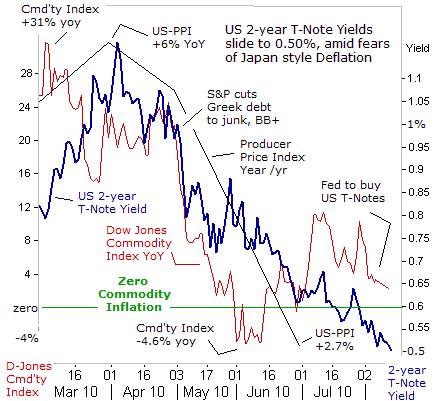
The Fed’s most immediate task is now aimed at preventing Japanese style deflation from emerging. The Fed could ease its QE-scheme further, through additional bond purchases and a pledge to keep the fed funds rate locked near zero-percent for two-years, if commodity prices should turn negative and slip into deflation territory. If the psychology of American households and businesses begins to expect that prices won’t move higher, and instead, expect them to fall, they will act accordingly by slowing spending. Japanese households and business have become conditioned to expect falling prices, and ultra-low JGB yields.
German Bund Yields Tumble, as Banks freeze lending
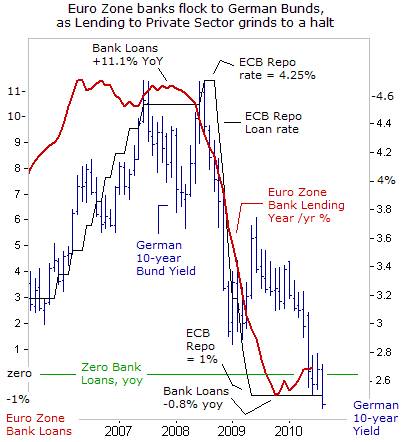 German 10-year Bund yields plunged to 2.44% this week, the lowest since 1989, while 2-year schatz yields tumbled to 64-bps, sliding in sympathy with the decline in British, Japanese, and US Treasury yields. Net lending by Euro-zone banks to the private sector has been frozen for almost a year, leading to fears that a dearth of credit can stifle growth in the world’s second largest trading bloc. Instead, Euro-zone banks are funneling excess liquidity into German bunds. The ECB is also offering unlimited amounts of Euros to banks, in order to induce them to buy riskier Greek, Spanish, and Portuguese bonds, through backdoor QE.
At the G-20 finance ministers’ meeting in Toronto on June 4-5th, - contrary to initial expectations, the Euro-zone’s politicians emphasized the need for debt and deficit reduction rather than stimulus measures to bolster economic growth. The change in tone reflected the impact of the “sovereign debt” crisis in Europe, which threatened to spark a financial crisis even more serious than that which followed the collapse of Lehman Brothers. But Germany’s newly adopted austerity plan could endanger its economic recovery, - seen as crucial to the region’s economic prospects.
On July 7th, Germany’s government agreed to slash its bloated budget deficit by a total 80-billion Euros over four-years, through spending cuts and tax hikes. Finance Minister Wolfgang Schaeuble said the plans put Germany on track to cut its budget deficit to below 3% of gross domestic product by 2013. “Nobody can seriously dispute that excessive public deficits, not only in Europe, are one of the main causes of this crisis. This is why they have to be cut.” he warned. Bonn aims to reduce new borrowing to 65-billion Euros this year and 57.5-billion Euros in 2011, - sweet music to the ears of bullish German bunds traders.
Gold market defies Deflation scare
So far, the prospect of Japanese style deflation spreading to other G-7 industrialized nations hasn’t scared off the hard-core Gold bugs. In New York, the yellow metal is still changing hands near $1,200 /oz, or nearly double the levels that prevailed five years ago. Intuitively, one could expect that the Gold market would thrive in an environment of near zero-percent interest rates, coupled with massive monetization of government debt by central banks, and bailouts of the banking Oligarchs.
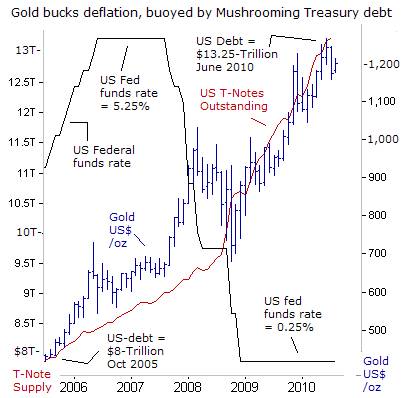 The US-Treasury issued $165-billion of fresh debt during July, and so far in the first 10-months of fiscal 2010, - ending Sept 30th, - the shortfall has totaled $1.17- trillion. July’s deficit marked the 22nd straight month of red ink for the US government, the longest string on record. If the US-economy slips into a “double-dip” recession, it could weaken tax revenues, - thus the Fed’s sleight of hand, in shifting maturing debt in mortgage backed bonds, - into Treasuries.
US President Barack Obama has made a last-minute pitch for aid to financially struggling states. Obama and the Democratic led Congress aim to send $16-billion for Medicaid and $10-billion for schools in order to prevent states from defaulting on their debts. US-states could face budget shortfalls of more than $120 billion this year. Thus, the Fed could soon be in the business of bailing out individual US-states, and not just Washington and banksters.
For Gold bugs, - more government debt equals more printing of US-dollars by the central bank. Bernanke didn’t authorize a new round of money printing this week, - just a shuffling of paper money already in circulation. Yet a resumption of full scale QE still looms on the horizon.
Deflationist enthusiasts, - rushing to gobble-up Japanese bonds, - also face a major price risk that could lead to severe losses, within a relatively short period of time. On August 11th, Japan’s Ministry of Finance sold 2.4-trillion yen ($28 billion) of five-year JGB’s with a 0.30% coupon, the lowest in seven years. The auction attracted bids that were 4.7-times the offer, the highest since 2005. That compares an average bid-to-cover ratio of 3.47 from the past 12-auctions. Beijing has been a buyer of 1.7-trillion yen ($20-billion) of JGB’s so far in 2010.
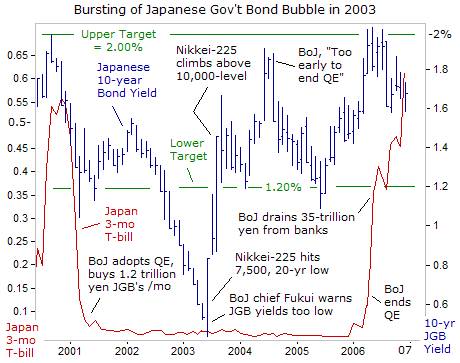
Still, traders are mindful of the bursting of the JGB bubble in mid-2003, when yields quadrupled within four-months. Traders were lured into bidding-up JGB’s until the 10-year yield had fallen to a historic low of 0.43%, under the influence of the BoJ’s hallucinogenic QE-drug. However, JGB yields suddenly reversed and surged sharply higher to 1.65%. JGB losses continued to mount through 2006, when the BoJ scrapped its QE-scheme, and 10-year yields climbed to 2-percent.
Someday, it might dawn on bullish speculators in US Treasury debt, that the fear of a deflationary spiral is just a propaganda ploy, devised by central banks, to drive down the cost of financing government debt. If you think there’s deflation in the air, look around you. Prices are not falling for basic services, food, or energy. However, the American middle class is under siege from slumping home prices and cuts in wages and medical benefits. As John Maynard Keynes used to say, “The market can stay irrational longer than you can stay solvent.”
This article is just the Tip of the Iceberg of what’s available in the Global Money Trends newsletter. Subscribe to the Global Money Trends newsletter, for insightful analysis and predictions of (1) top stock markets around the world, (2) Commodities such as crude oil, copper, gold, silver, and grains, (3) Foreign currencies (4) Libor interest rates and global bond markets (5) Central banker "Jawboning" and Intervention techniques that move markets.
By Gary Dorsch,
Editor, Global Money Trends newsletter
http://www.sirchartsalot.com
GMT filters important news and information into (1) bullet-point, easy to understand analysis, (2) featuring "Inter-Market Technical Analysis" that visually displays the dynamic inter-relationships between foreign currencies, commodities, interest rates and the stock markets from a dozen key countries around the world. Also included are (3) charts of key economic statistics of foreign countries that move markets.
Subscribers can also listen to bi-weekly Audio Broadcasts, with the latest news on global markets, and view our updated model portfolio 2008. To order a subscription to Global Money Trends, click on the hyperlink below, http://www.sirchartsalot.com/newsletters.php or call toll free to order, Sunday thru Thursday, 8 am to 9 pm EST, and on Friday 8 am to 5 pm, at 866-553-1007. Outside the call 561-367-1007.
Mr Dorsch worked on the trading floor of the Chicago Mercantile Exchange for nine years as the chief Financial Futures Analyst for three clearing firms, Oppenheimer Rouse Futures Inc, GH Miller and Company, and a commodity fund at the LNS Financial Group.
As a transactional broker for Charles Schwab's Global Investment Services department, Mr Dorsch handled thousands of customer trades in 45 stock exchanges around the world, including Australia, Canada, Japan, Hong Kong, the Euro zone, London, Toronto, South Africa, Mexico, and New Zealand, and Canadian oil trusts, ADR's and Exchange Traded Funds.
He wrote a weekly newsletter from 2000 thru September 2005 called, "Foreign Currency Trends" for Charles Schwab's Global Investment department, featuring inter-market technical analysis, to understand the dynamic inter-relationships between the foreign exchange, global bond and stock markets, and key industrial commodities.
Copyright © 2005-2010 SirChartsAlot, Inc. All rights reserved.
Disclaimer: SirChartsAlot.com's analysis and insights are based upon data gathered by it from various sources believed to be reliable, complete and accurate. However, no guarantee is made by SirChartsAlot.com as to the reliability, completeness and accuracy of the data so analyzed. SirChartsAlot.com is in the business of gathering information, analyzing it and disseminating the analysis for informational and educational purposes only. SirChartsAlot.com attempts to analyze trends, not make recommendations. All statements and expressions are the opinion of SirChartsAlot.com and are not meant to be investment advice or solicitation or recommendation to establish market positions. Our opinions are subject to change without notice. SirChartsAlot.com strongly advises readers to conduct thorough research relevant to decisions and verify facts from various independent sources.
Gary Dorsch Archive |
© 2005-2022 http://www.MarketOracle.co.uk - The Market Oracle is a FREE Daily Financial Markets Analysis & Forecasting online publication.


