


Gold, Crude Oil, SP500 and U.S. Dollar Trading At Key Pivot Points
Stock-Markets / Financial Markets 2010 Aug 15, 2010 - 04:47 PM GMTBy: Chris_Vermeulen

 Last week was exciting as investments rocketed higher or tank… We saw Gold and the US Dollar pop while oil and equities dropped sharply with heavy volume.
Just to recap, Wednesday the market went into free-fall mode sending traders and investors running for the door. This was obvious from looking at the large percent drop coupled with heavy selling. That day the NYSE showed panic selling with 37 shares sold for every 1 share purchased meaning pure panic. In my Wednesday night report “How to Take Advantage of Panic Selling for SP500 and Gold ” I explained how to read these extreme market conditions and what to expect the following sessions.
Currently the price of gold, oil, spx are trading somewhat at the opposite extremes seen last week. Below are a few charts explaining the situations:
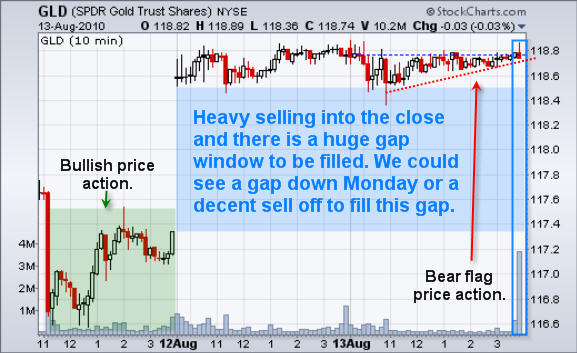
GLD – Gold ETF Trading Signals
This 60 minute chart shows gold getting hit hard on Wednesday morning. Investors and traders around the globe were closing out positions and moving to cash. This high volume dumping of positions pulled virtually all investments lower and was the first tip-off that the market was in panic mode.
One the dust settled and investor’s regrouped we saw money surge back into gold creating a nice pop the following day. Problem I see is that gold is now trading at a key resistance level when reviewing the daily chart. And if you take a look at the 60 minute chart below you can see the price of gold sold down in the morning on August 13th and drifted up into the close on Friday forming a bearish wedge. Also there was some very strong selling just before the market closed which is also a concern.
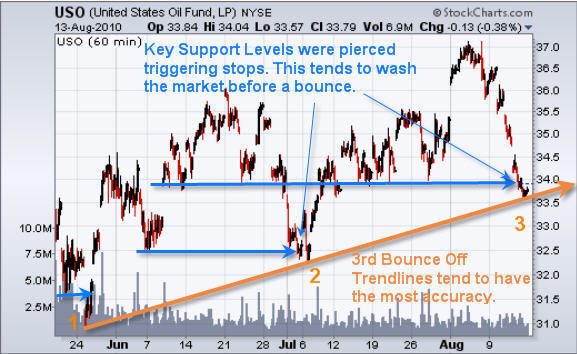
USO – Oil Traded Fund
Both times oil has fallen we have seen the price pierce key support levels where the bulls would have the majority of their stops placed. The intraday pierce causes the stops to be triggered washing the market of long positions while the smart money loads up accumulating everyone’s sell orders . This is something which happens with virtually every type of investment and the main reason traders get shaken out just before the market goes in their direction. Anyways, running of the stops is something I will cover in a future report.
Looking at the chart below you can see oil trading at trendline support. Each time the key support levels (blue arrows) have been pierced the market has rocketed higher. Just from looking at the chart from August 9th forward you can see that this move down is overextended and visually looks ready for a pause or bounce in the coming days.
*Trading Tidbit - When trading trendlines it is important to try and play the third test. Reason being is that the first two pullbacks create the trendline and the third test is when active traders generally jump on board causing a sizable bounce. Each test of a trendline it becomes weaker and the probability of a breakdown is more likely.*
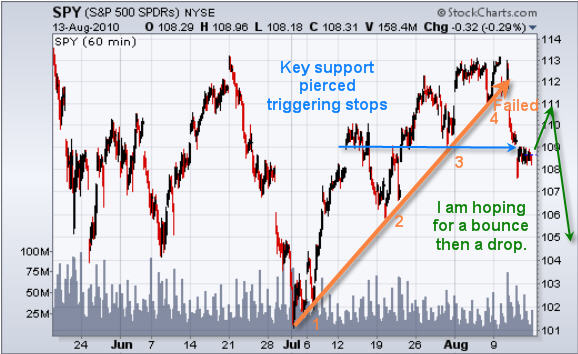
SPY – SP500 ETF Trading Fund
The SP500 chart shows last week’s breakdown on the 5th test of the trendline. The market is oversold here and ready for a bounce which I hope we get this week. My concern is that the downward momentum is to strong and a bounce will be negated.
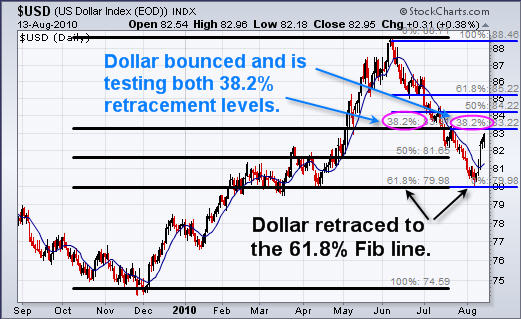
US Dollar Index
US dollar put in a huge bounce last week after testing is 61.8% Fib retracement level from the 2009 December low. The strong bounce has pushed the dollar up to a key resistance level which happens to be 38.2% Fib retracement level from both the December up trend and the recent sell off. I figure this will hold the dollar down for a few days easing the pressure on oil and equities.
Weekend Gold, Oil, SPX and Dollar Trading Conclusion:
In short, I feel there will be a relief bounce in oil and equities while the dollar and gold will have some profit taking and trade sideways or down at the beginning of the week. After that it looks as though stocks and oil will head lower while the dollar and gold rally.
If you would like to receive my Trading Analysis and Signals Complete with Entry, Targets and Protective Stops please visit my website at: www.TheGoldAndOilGuy.com
By Chris Vermeulen
Chris@TheGoldAndOilGuy.com
Please visit my website for more information. http://www.TheGoldAndOilGuy.com
Chris Vermeulen is Founder of the popular trading site TheGoldAndOilGuy.com. There he shares his highly successful, low-risk trading method. For 6 years Chris has been a leader in teaching others to skillfully trade in gold, oil, and silver in both bull and bear markets. Subscribers to his service depend on Chris' uniquely consistent investment opportunities that carry exceptionally low risk and high return.
This article is intended solely for information purposes. The opinions are those of the author only. Please conduct further research and consult your financial advisor before making any investment/trading decision. No responsibility can be accepted for losses that may result as a consequence of trading on the basis of this analysis.
Chris Vermeulen Archive |
© 2005-2022 http://www.MarketOracle.co.uk - The Market Oracle is a FREE Daily Financial Markets Analysis & Forecasting online publication.