


Combining Economic and Stock Index Technical Analysis
Stock-Markets / Stock Markets 2010 Aug 16, 2010 - 01:53 PM GMTBy: Sy_Harding

 Current worries about another global economic slowdown began months ago with news of the euro-zone’s debt crisis, and more recently the austerity measures Europe has adopted to tackle budget deficits. Worries then worsened with reports of China’s slowing growth, and indications of the severity of the slowdown in the U.S.
Piling it on, Japan reported last night that its economic growth crumbled in the 2nd quarter. Its GDP grew at a sickly 0.4% annualized rate in the 2nd quarter, down from its 4.4% pace in the 1st quarter, and significantly worse than forecasts that its growth would slow significantly, but only to 2.3%.
The potential seriousness of the situation can be seen if we look at the importance of the economies in those regions – the euro-zone, the U.S., China, and Japan.
The 16-nation European Union is the largest combined economy in the world (data as of the end of 2009). The U.S. is the largest single country economy in the world. Japan is the second largest single-country economy, with China close behind (and expected to pass Japan this year).
So, we’re talking about the four largest economic regions in the world, which account for 90% of total global GDP.
Even if the remaining global economies could somehow escape being affected by the problems of the big-four, it would not make much difference. Outside of the EU, the U.S., China, and Japan, the next largest economies on the list are the U.K., Brazil, Canada, and India, and their combined GDP is less than 7% of the global total.
The stock markets in China and Japan have seen the problem coming. China’s market has been in a bear market since its peak in July of last year, down as much 36% just prior to the recent July rally. Japan’s market is now down 19%, on the edge of a 20% decline that is the official indication of a bear market.
However, European and U.S. stock markets are apparently not all that worried – at least not yet. The S&P 500 is down just 10% from its April peak. The stock markets of the big three of Europe (Germany, Britain, and France) are down an average of only 8.1%.
It’s an interesting divergence given that global economies historically experience boom times and retrenchments, as well as bull and bear markets, pretty much in lockstep with each other.
Technical analysis provides some clues as to how the divergence may be resolved.
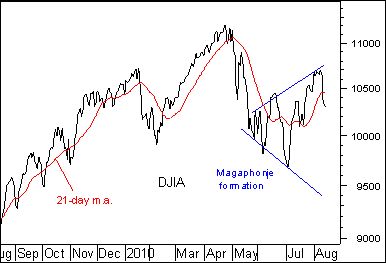
Short-term, the Dow, S&P 500, and DJ Transportation Average are in a rare broadening top, or ‘megaphone’ formation that has bearish implications.
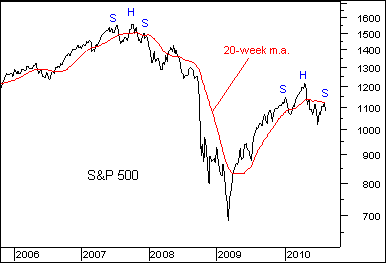
Longer-term, the Dow, S&P 500, and Nasdaq have potentially seen their July rally end at the overhead resistance at their 20-week moving averages, which also halted their previous short-term rallies since the market peak in April. That also leaves them with a potential head and shoulders top in place (marked S,H,S in the chart) similar to that in October, 2007.
Time to consider market-timing?
Sy Harding is president of Asset Management Research Corp, publishers of the financial website www.StreetSmartReport.com, and the free daily market blog, www.SyHardingblog.com.
© 2010 Copyright Sy Harding- All Rights Reserved
Disclaimer: The above is a matter of opinion provided for general information purposes only and is not intended as investment advice. Information and analysis above are derived from sources and utilising methods believed to be reliable, but we cannot accept responsibility for any losses you may incur as a result of this analysis. Individuals should consult with their personal financial advisors.
© 2005-2022 http://www.MarketOracle.co.uk - The Market Oracle is a FREE Daily Financial Markets Analysis & Forecasting online publication.