


U.S. Markets and Economic Contraction...
Stock-Markets / Financial Markets 2010 Aug 20, 2010 - 08:29 AM GMTBy: Mark_McMillan

 The Philly Fed report really shook up a lot of investors who had counted on a continued modest expansion.
Recommendation: Take no action.
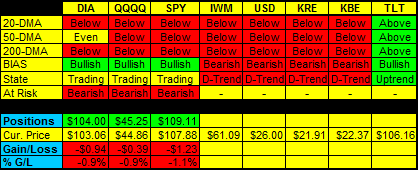
- Positions indicated as Green are Long positions and those indicated as Red are short positions.
- The State of the Market is used to determine how you should trade. A trending market can ignore support and resistance levels and maintain its direction longer than most traders think it will.
- The BIAS is used to determine how aggressive or defensive you should be with a position. If the BIAS is Bullish but the market is in a Trading state, you might enter a short trade to take advantage of a reversal off of resistance. The BIAS tells you to exit that trade on "weaker" signals than you might otherwise trade on as the market is predisposed to move in the direction of BIAS.
- At Risk is generally neutral represented by "-". When it is "Bullish" or "Bearish" it warns of a potential change in the BIAS.
- The Moving Averages are noted as they are important signposts used by the Chartists community in determining the relative health of the markets.
Current ETF positions are:
DIA: Short at $105.19
QQQQ: Short at $45.91
SPY: Short at $110.65
Daily Trading Action
The major index ETFs opened lower and after wavering briefly, moved up for about fifteen minutes before rolling over and heading lower as traders awaited the economic reports due out at the top of the hour. The markets sold off hard on the release of the economic reports and continued to slide until around noon. The major indexes then rallied modestly through the lunch hour before the bears began to move them lower. The bulls intervened before the major indexes could reach their late morning lows and most of the rest of the session was spent moving higher, with some selling in the last half hour to see the major indexes close nearer their intraday bottoms than their tops. All three finished below all the Day Moving Averages (DMAs) we regularly report on except for the Dow which managed to close about even with its 50-DMA. The Russell-2000 (IWM 61.09 -1.72) lost only 1.6%. The Bank Index (KBE 22.37 -0.56) lost 2.4% and the Regional Bank Index (KRE 21.91 -0.55) lost 2.5%. The 20+ Yr Bonds (TLT 106.16 +1.63) soared 1.6% as investors continue to seek the relative safety of bonds. NYSE volume increased to light levels with just 1.073B shares traded. NASDAQ share volume was below average with 2.086B shares traded.
There were four economic reports of interest released:
- Initial Jobless Claims for last week came in at 500K versus an expected 475K
- Continuing Jobless Claims came in at 4.478M versus an expected 4.5M
- Leading Economic Indicators (Jul) came in at +0.1% versus an expected +0.2%
- Philadelphia Fed (Aug) came in at -7.7 versus an expected +7.5
The first two reports were released an hour before the open and futures immediately dove on the news but mostly recovered before the open. The other two reports were released a half hour into the session and set off a wave of selling.
The Fed has twelve districts with each district issuing reports on the health of the economy within their borders. The Philadelphia Fed report is closely watched along with the Chicago Purchasing Managers Index (PMI) as barometers of the economy generally. When the Philly Fed report showed a contracting economy rather than an expanding one, it was a big surprise. Chicago PMI isn't due out until August 31st in another week and a half. Revised Q2 GDP numbers will be released at the end of next week.
All ten economic sectors in the S&P-500 moved lower, led by Financials (-2.4%).
Implied volatility for the S&P-500 (VIX 26.44 +1.85) rose seven and one half percent while the implied volatility for the NASDAQ-100 (VXN 26.90 +0.92) rose three and one half percent.
The yield for the 10-year note fell six basis points to close at 2.58. The price of the near term futures contract for a barrel of crude oil fell ninety-nine cents to close at $74.43.
Market internals were negative with decliners leading advancers 4:1 on both the NYSE and the NASDAQ. Down volume led upo volume by 6:1 on the NYSE and by 5:1 on the NASDAQ. The index put/call ratio fell 0.67 to close at 1.22. The equity put/call ratio rose 0.08 to close at 0.75.
Commentary:
Thursday's intra-session economic reports really changed sentiment. Expected modest growth turned into economic contraction which has many investors concerned. The three major index ETFs have been contained below their 200-DMAs and are threatening to collapse yet again. While the BIAS for the major indexes continues to be bullish, all the other equity indexes we regularly report on have a BEARISH BIAS. It is not often that the major indexes are this out of sync with other equity indexes. We will maintain our positions for another day as we wait to see how the markets trade on Friday.
We hope you have enjoyed this edition of the McMillan portfolio. You may send comments to mark@stockbarometer.com.
If you are receiving these alerts on a free trial, you have access to all of our previous articles and recommendations by clicking here. If you do not recall your username and/or password, please email us at customersupport@stockbarometer.com.
By Mark McMillan
Important Disclosure
Futures, Options, Mutual Fund, ETF and Equity trading have large potential rewards, but also large potential risk. You must be aware of the risks and be willing to accept them in order to invest in these markets. Don't trade with money you can't afford to lose. This is neither a solicitation nor an offer to buy/sell Futures, Options, Mutual Funds or Equities. No representation is being made that any account will or is likely to achieve profits or losses similar to those discussed on this Web site. The past performance of any trading system or methodology is not necessarily indicative of future results.
Performance results are hypothetical. Hypothetical or simulated performance results have certain inherent limitations. Unlike an actual performance record, simulated results do not represent actual trading. Also, since the trades have not actually been executed, the results may have under- or over-compensated for the impact, if any, of certain market factors, such as a lack of liquidity. Simulated trading programs in general are also subject to the fact that they are designed with the benefit of hindsight. No representation is being made that any account will or is likely to achieve profits or losses similar to those shown.
Investment Research Group and all individuals affiliated with Investment Research Group assume no responsibilities for your trading and investment results.
Investment Research Group (IRG), as a publisher of a financial newsletter of general and regular circulation, cannot tender individual investment advice. Only a registered broker or investment adviser may advise you individually on the suitability and performance of your portfolio or specific investments.
In making any investment decision, you will rely solely on your own review and examination of the fact and records relating to such investments. Past performance of our recommendations is not an indication of future performance. The publisher shall have no liability of whatever nature in respect of any claims, damages, loss, or expense arising out of or in connection with the reliance by you on the contents of our Web site, any promotion, published material, alert, or update.
For a complete understanding of the risks associated with trading, see our Risk Disclosure.
© 2010 Copyright Mark McMillan - All Rights Reserved
Disclaimer: The above is a matter of opinion provided for general information purposes only and is not intended as investment advice. Information and analysis above are derived from sources and utilising methods believed to be reliable, but we cannot accept responsibility for any losses you may incur as a result of this analysis. Individuals should consult with their personal financial advisors.
© 2005-2022 http://www.MarketOracle.co.uk - The Market Oracle is a FREE Daily Financial Markets Analysis & Forecasting online publication.