Six Reasons To Buy Stocks In The Short-Term
Stock-Markets / Stock Markets 2010 Aug 23, 2010 - 12:01 PM GMTBy: David_Grandey
 When looking at the charts, we see a potential bull count, specifically this wave 2 morphing into a bigger wave 2.
What is interesting are a few tidbits that make us think a little deeper about us possibly being still in wave 2.
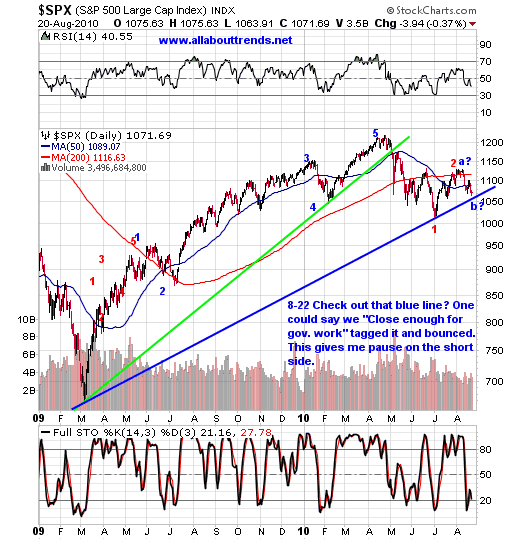
1. The S&P 500 chart off the March 2009 lows through present shows that of a recent uptrend line being created off the July lows. That trendline was dang near touched Friday as shown below.

2. Options expiration. Last weekend we talked about how typically they move the market the opposite direction that most people think and how we had the feeling that the four down days prior to going into options expiration week may not have been enough bearishness to turn the tide vs. the uptrend off the July lows. Sure enough it wasn’t and the market to those who were still emotionally attached to the uptrend outcome got hammered.
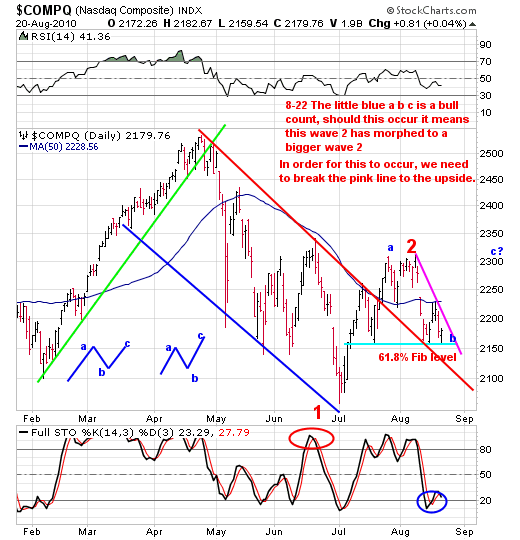
3. Friday the OTC Comp (remember it and the Russell 2000 LEAD the market) hit the 61.8% fib level earlier in the week and FAILED TO BUST TO THE DOWNSIDE. Said another way — the 61.8% fib level held and we got a reaction off of it. Even a fair amount of the names in play on our follow the leaders list for the most part took it all in stride. A fair amount of the recent go go names also just treaded water when all was said and done.

Notice we still have a gap that could still yet be filled just over the 50 day average?
Also notice since late May the OTC Comp hasn’t really gone anywhere? Ahhh but a fair amount of individual stocks have and that’s where our focus is going to be on next week.
Bottom line on this chart are two things we want to really key in on.
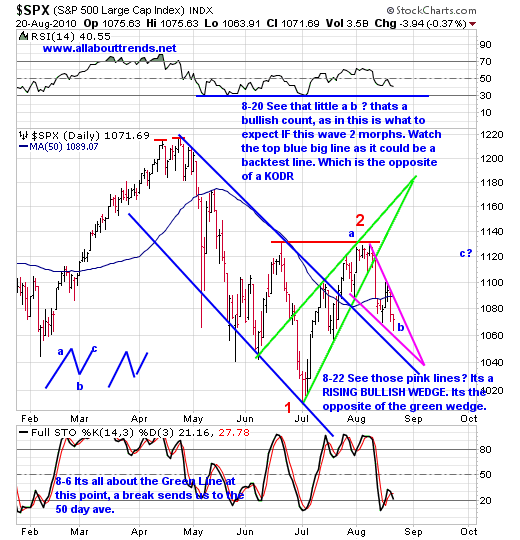
The lows pretty much need to hold (light blue line). But even if it doesn’t don’t despair as there are the makings of a falling bullish wedge (See SPX chart below.
We need to break the pink line to the upside if we are going to stage an abc to the upside pattern as shown above.
4. The Hindenburg Omen apparently triggered late last week Remember what we said about whenever the blogosphere and everyone starts talking about something it’s about time to do the opposite? Well, we are there.
5. The charts also show the makings of a potential B wave pullback in a bigger wave 2 abc up. Not to mention a backtest of the bigger trend channel from the April highs through the July lows as shown in blue in the chart below.

6. September is already being touted as a bad month historically and seeing as how we are approaching it from an overold condition a headfake to the upside would not be out of line due to the bearishness out there. It wouldn’t surprise us in the least. In fact it would be the perfect set up.
Mess with the bears some more by staging a C wave up to retest the 1131 level perhaps? That is just enough to suck in the bulls then as what is normally true with bear market rallies, short cover rallies and the like. That being they would suck in the little guy, make him feel all excited, get him all emotional and then?
BURY HIM.
Please keep in mind that we’re not construeing we are going to follow that path (don’t get attached to this outcome). We’re just saying it’s a great set up that makes perfect sense and besides the last week or so was very difficult due to blink your eyes you missed it for both the bulls and bears alike as the big moves as usual lately took place in the form of a gap. After the gaps you really got no decent follow through in either direction unless you were already there and they were news events generally speaking.
It really has that look and feel of being more of a market of stocks than it is a stockmarket with more stocks trading to the beat of their own drum if you will. And that is where our focus is going to be next week – individual stocks.
The bearish side of the equation is that we are in wave 3
What bothers us about it is that of this supposed wave 3 is that it really hasn’t thus far lived up to its name (“The Wonder To Behold”) We mean where are the fireworks, where’s the shock and awe?
We can see the wave 1 down on the big picture chart and we see us being in the wave 2 rising wedge break and us now being in the supposed dreaded wave 3. We see that and we all do, but where is the decisivness. Where is the “with conviction” impulse move to the down side?
We’re not saying it’s not going to happen but it sure seems at this moment in time like a dud.
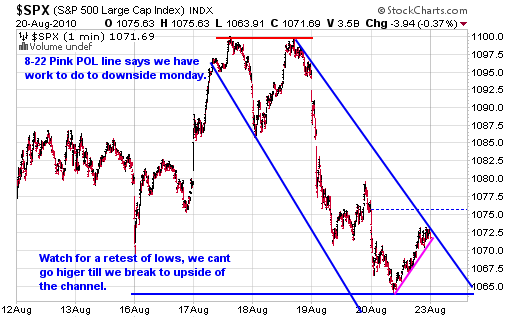
That all said we are going to use the short term SPX chart early next week to key our trades off of.

By David Grandey
www.allabouttrends.net
To learn more, sign up for our free newsletter and receive our free report -- "How To Outperform 90% Of Wall Street With Just $500 A Week."
David Grandey is the founder of All About Trends, an email newsletter service revealing stocks in ideal set-ups offering potential significant short-term gains. A successful canslim-based stock market investor for the past 10 years, he has worked for Meriwest Credit Union Silicon Valley Bank, helping to establish brand awareness and credibility through feature editorial coverage in leading national and local news media.
© 2010 Copyright David Grandey- All Rights Reserved Disclaimer: The above is a matter of opinion provided for general information purposes only and is not intended as investment advice. Information and analysis above are derived from sources and utilising methods believed to be reliable, but we cannot accept responsibility for any losses you may incur as a result of this analysis. Individuals should consult with their personal financial advisors.
© 2005-2022 http://www.MarketOracle.co.uk - The Market Oracle is a FREE Daily Financial Markets Analysis & Forecasting online publication.


