


SPX Bounces as Nasdaq Readies for its Next Flash Stock Market Crash
Stock-Markets / Financial Markets 2010 Sep 05, 2010 - 05:32 AM GMT

 FDIC Friday back on the job. -
The FDIC Failed Bank List announced no new bank closures this week. The total number of institutions on the troubled banks list rose to 829 from 775. That means more than 10% of the banks insured by the FDIC are designated as troubled. The number of problem institutions is at its highest rate in 17 years. In 1993, more than 900 banks were deemed troubled.
FDIC Friday back on the job. -
The FDIC Failed Bank List announced no new bank closures this week. The total number of institutions on the troubled banks list rose to 829 from 775. That means more than 10% of the banks insured by the FDIC are designated as troubled. The number of problem institutions is at its highest rate in 17 years. In 1993, more than 900 banks were deemed troubled.
Is Another Flash Crash Inevitable By Year’s End And Will It Be Triggered On Purpose?
(Forbes) If we don’t see a Flash Crash II, we’ll certainly see events that mimic the quote volume spike of May 6–one of the factors that many people, including Nanex CEO Eric Scott Hunsader, believe played a role in the short-lived collapse.
In fact, adds Hunsader, somebody could be intentionally slowing down some aspects of the market–using excessive quote blasts–to skim profits from clueless competitors. This won’t stop, Hunsader says, until the SEC or the exchanges step in and do something about the copious quote volume wars currently taking place.
Nanex, which sends its clients compressed real-time quote feeds and market data, has drawn attention lately for some of the underlying quote patterns it uncovered within the chaos of trading on May 6. But it wasn’t odd patterns that drove the market to madness; it was pure volume.
Why The End Of The 'Equity Cult' Means Trillions In Upcoming Outflows From Stocks
(ZeroHedge) …Citi has just pronounced the "Equity Cult" dead: "It has taken 10 years, and two 50% bear markets, to reverse this cult. European and Japanese equities are already trading on dividend yields above government bond yields. US equities are almost there as well.
The VIX retests its 10-week M.A.
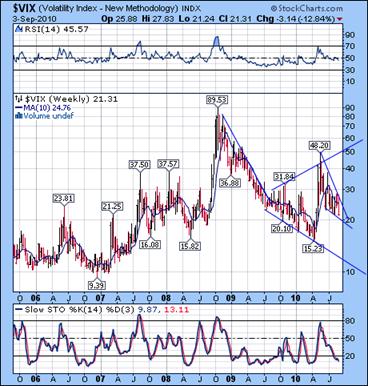 --The VIX made an 81.8% retracement of its spike up from April this week. This appears to be excessive in the context of the Broadening Formation, which calls for an average 50% retracement. However, it now appears to have finished or nearly completed a declining wedge formation, which indicates a bullish reversal is imminent.
SPX bounces at the 1040 level.
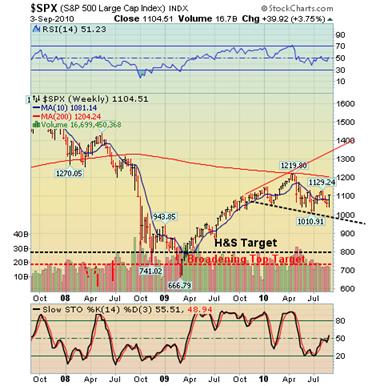 -- It appears that the 1040 level was again well defended this week. The Primary Trend is still down. The decline bottoming on August 27 appears to be an impulse in all the equity indexes and ETFs but SPY, which may have had a truncated low instead. The perceived incompleteness of the declining pattern made it appear that the decline would extend as it did in 2008, but that did not occur. The subsequent rally was done on the lowest volume of the year.
It appears that these flash rallies are meant to keep short sellers at at bay. Has it occurred to anyone that it eliminates potential buyers at the bottom of a decline?
The NDX readies for its next Flash Crash.
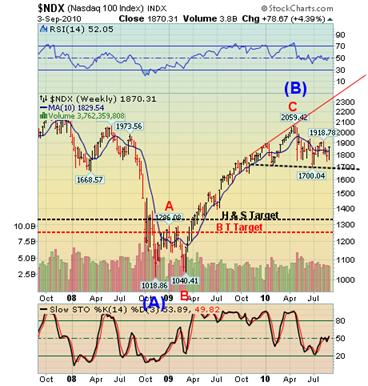 --The unusually large rally in the NDX may be blamed on the HFT computers taking advantage of a light volume, pre-holiday week. However, the perception of the trading community seems to be that a rally to new highs is beginning. This may be attributed to the unusually high emotional influence of the Broadening Top, which seems to have highly irregular trading volume patterns.
Friday had another 90% up day, giving us three 90% up days and two 90% down days within two weeks. The market is vacillating between manic and panic. This cannot last. The next 90% down day may break the support.
Gold takes one more stab at the trendline.
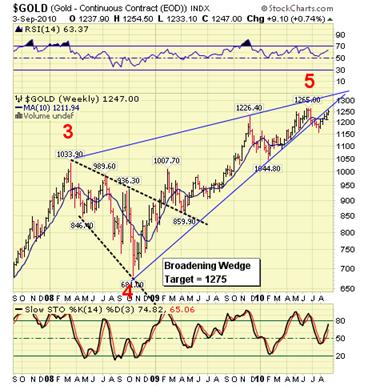 -- The equity rally is getting the blame for gold’s sub-par performance this week. But if the economy slips back into a recession, Nouriel Roubini suggests that the dollar , yen and Swiss franc would perform better.
“If there was a double-dip recession, increasing risk aversion, some assets are going to be preferred, and gold will be one of them,” Roubini said today in an interview on Bloomberg Television’s ‘On The Move’ with Francine Lacqua. “But in that situation, things like the dollar, the yen, the Swiss franc have more upside in a situation of rising risk aversion because they are much more liquid than the gold market.”
$WTIC remains under its 10-week moving average.
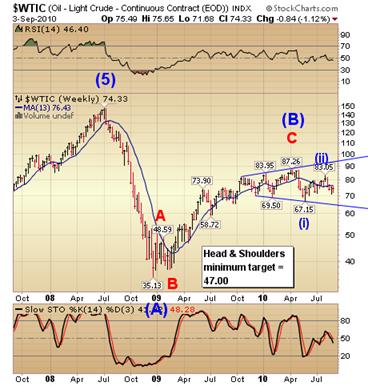 -- $WTIC remained below its 10-week moving average this week. While we cannot rule out the possibility of another spike in oil above the 10-week moving average, the patterns support a resumption of the decline below the Broadening Formation.
The Bank Index may have a lower neckline.
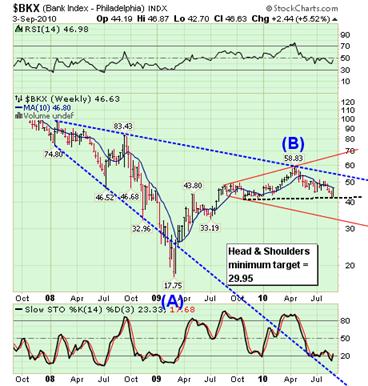 --The surge back to the 10-week moving average in $BKX suggests a neckline that is lower than the one previously illustrated. The reason is that a neckline that is violated after a right shoulder is usually not re-crossed. There is some subjectivity when drawing the neckline of a Head & Shoulders pattern, but I have found that the ideal position is the bottom of a first wave, where wave three slices through and only occasionally retests the neckline.
The Shanghai Index remains above its 10-week moving average.
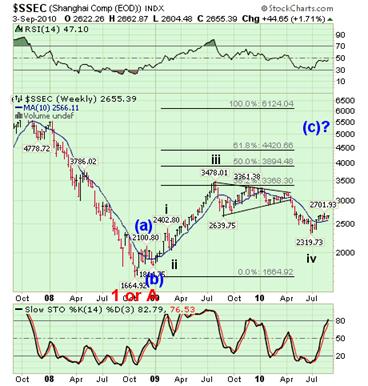 --The Shanghai Index appears to have made a shallow Trading Cycle low above its 10-week moving average, which may allow it to resume its uptrend. The next higher resistance is at 2720 which, if crossed, may become support for the next leg of the rally. If gold and the long bond decline with equities in the coming meltdown, there will be a rush to assets that appear to hold their value.
The fact that $SSEC remained above 2556.11 for its Trading Cycle low will not go unnoticed.
$USB has retraced its throw-over.
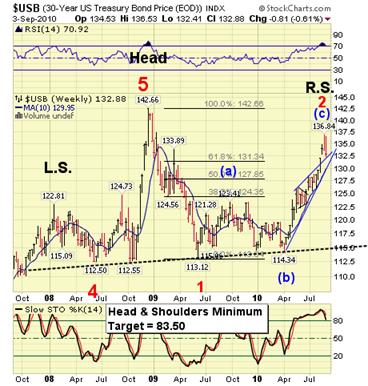 -- $USB has not looked back from the reversal which started at the Bernanke speech last Friday. The irony of it all is that, if the reversal follows through, the cost of Bernanke’s plans will skyrocket and inevitably destroy our Sovereign credit rating. The bond vigilantes have finally awakened from their slumber.
The cycles anticipate two distinct new lows within the month of September. A decline to the trendline may be imminent.
$USD appears ready to challenge its neckline.
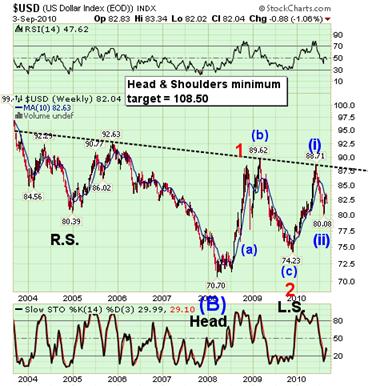 -- The rally in $USD remained stalled at its 10-week moving average at 82.63 this week. Last Monday’s cycle pivot brought an extension of the retracement, so this week’s pivot will likely bring the emergence of $USD above the 10-week moving average.
EW relationships suggest that this rally should go to 103.54, before extensions, while the Head & Shoulders pattern argues for 108.50, once the neckline is surpassed. If it follows its normal cycle pattern, we may see its wave (iii) top near election day.
I hope you all have a wonderful weekend!
Regards,
Tony
Traders alert: The Practical Investor is currently offering the daily Inner Circle Newsletter to new subscribers. Contact us at tpi@thepracticalinvestor.com for a free sample newsletter and subscription information.
Our Investment Advisor Registration is on the Web
We are in the process of updating our website at www.thepracticalinvestor.com to have more information on our services. Log on and click on Advisor Registration to get more details.
If you are a client or wish to become one, please make an appointment to discuss our investment strategies by calling Connie or Tony at (517) 699-1554, ext 10 or 11. Or e-mail us at tpi@thepracticalinvestor.com .
Anthony M. Cherniawski, President and CIO http://www.thepracticalinvestor.com
As a State Registered Investment Advisor, The Practical Investor (TPI) manages private client investment portfolios using a proprietary investment strategy created by Chief Investment Officer Tony Cherniawski. Throughout 2000-01, when many investors felt the pain of double digit market losses, TPI successfully navigated the choppy investment waters, creating a profit for our private investment clients. With a focus on preserving assets and capitalizing on opportunities, TPI clients benefited greatly from the TPI strategies, allowing them to stay on track with their life goals
Disclaimer: The content in this article is written for educational and informational purposes only. There is no offer or recommendation to buy or sell any security and no information contained here should be interpreted or construed as investment advice. Do you own due diligence as the information in this article is the opinion of Anthony M. Cherniawski and subject to change without notice.
Anthony M. Cherniawski Archive |
© 2005-2022 http://www.MarketOracle.co.uk - The Market Oracle is a FREE Daily Financial Markets Analysis & Forecasting online publication.