


Hindenburg Omen Stock Market Update
Stock-Markets / Stock Markets 2010 Sep 05, 2010 - 05:37 AM GMTBy: Tim_Wood

Of late there has been a lot of attention on the Hindenburg Omen and the excessive number of 90% volume days. I’ve been receiving e-mails and phone calls asking me about this and how it affects my work. In short, it doesn’t. Here’s why.
I totally realize that the occurrence of the Hindenburg Omen and/or 90% panic days have appeared as a “precursor” if you will, to large moves. But, fact is, there are also incidences in which these events have appeared and it meant nothing. So, maybe these events mean something this time and maybe they don’t. Fact is, that is an unknown. I feel that such events are noteworthy, but I do not feel that they are anymore meaningful or reliable than the occurrence of say, a head and shoulders pattern or a rising wedge or the like. As I have explained for years, patterns can morph, evolve and even vanish. What may appear to be a head and shoulders pattern or a flag pattern today may not even exist next week or next month.
Obviously a Hindenburg Omen or a 90% panic day will not vanish or morph, but the point is, it may or may not mean anything. The other issue I have with these events is the mere fact that they are getting so much attention. I have heard commentators discussing this on CNBC, CNBC World and Bloomberg. This alone makes me skeptical. Sort of reminds me of early July when everyone and their dog were proclaiming a Dow theory “sell signal.” Thus, I would not bet on the market based solely on these events, but at the same time I’m not suggesting that we totally ignore them.
In my work, what I have found to be more reliable is a well grounded understanding of Dow theory, price behavior itself and the statistical implications of that price behavior, which are all derived from extensive studies of the market. As an example of such statistical implications, if I know that “X” percent of the time a given price behavior occurs that “Y” has been the outcome, then I feel that I’m much better off with that type of analysis than I am to base my core analysis on a pattern or some other event. Let me give you an example. In June and July 2008 as commodity prices were pressing up into new high territory, I warned publicly of a potential top. I saw this setup developing in February 2008 and it was then that I began covering the developments surrounding that setup with my subscribers.
By June and into July I specifically explained to my subscribers that the 3-year cycle in the CRB was at risk of peaking prior to a certain time period and that 100% of the time that this had occurred, the CRB had moved below the previous 3-year cycle low, which in turn put the CRB and commodities at risk of moving back down below their 2007 lows. At the time, this sounded ridiculous, even to me, but it happened. Point being, the call was made strictly based on price and the underlying statistics and nothing else. The other point here is that in my work I rely on price and the statistical implications of its movement. I feel that price trumps everything. I feel that everything known by all market participants, be it good, bad, big, small, fundamental or technical is discounted into price. If the occurrence of a particular event is truly a factor, then it too, will be discounted into price. So, my logic is that by relying on and reading price, I don’t have to be concerned with any other event.
Please understand that I am not discounting the occurrences of the Hindenburg Omen or anything else. They are what they are and they stand on their own. Again, I think that these are noteworthy events. The overall point to this article is to address the numerous e-mails and phone calls I’ve received asking me about my views specifically on the Hindenburg Omen, the 90% panic days and how it affects my work. The bottom line is that it does not impact my work, the cycles, my statistics, the Dow theory, nor does it change or impact my views in the slightest way.
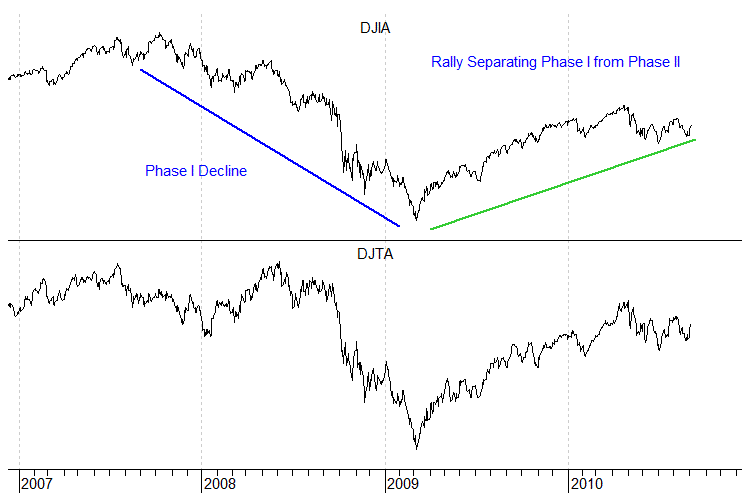
In accordance with Dow theory, the bullish primary trend associated with the bear market rally that began at the March 2009 low still remains intact. No doubt, that rally has run into some obstacles. But once again, it all boils down to price. What is more significant to me is price itself and the underlying statistical implications. If the statistical DNA Markers that I have found to have occurred at every major market top since the inception of the averages in 1896 prove to fall into place, then that will mean more to me than anything else. The current Dow theory chart can be found below.
I have begun doing free market commentary that is available at www.cyclesman.info/Articles.htm The specifics on Dow theory, my statistics, model expectations, and timing are available through a subscription to Cycles News & Views and the short-term updates. I have gone back to the inception of the Dow Jones Industrial Average in 1896 and identified the common traits associated with all major market tops. Thus, I know with a high degree of probability what this bear market rally top will look like and how to identify it. These details are covered in the monthly research letters as it unfolds. I also provide important turn point analysis using the unique Cycle Turn Indicator on the stock market, the dollar, bonds, gold, silver, oil, gasoline, the XAU and more. A subscription includes access to the monthly issues of Cycles News & Views covering the Dow theory, and very detailed statistical based analysis plus updates 3 times a week.
By Tim Wood
Cyclesman.com
© 2010 Cycles News & Views; All Rights Reserved
Tim Wood specialises in Dow Theory and Cycles Analysis - Should you be interested in analysis that provides intermediate-term turn points utilizing the Cycle Turn Indicator as well as coverage on the Dow theory, other price quantification methods and all the statistical data surrounding the 4-year cycle, then please visit www.cyclesman.com for more details. A subscription includes access to the monthly issues of Cycles News & Views covering the stock market, the dollar, bonds and gold. I also cover other areas of interest at important turn points such as gasoline, oil, silver, the XAU and recently I have even covered corn. I also provide updates 3 times a week plus additional weekend updates on the Cycle Turn Indicator on most all areas of concern. I also give specific expectations for turn points of the short, intermediate and longer-term cycles based on historical quantification.
Tim Wood Archive |
© 2005-2022 http://www.MarketOracle.co.uk - The Market Oracle is a FREE Daily Financial Markets Analysis & Forecasting online publication.