


Dynamics of Poverty, the Destitute Index
Politics / Social Issues Sep 06, 2010 - 03:01 AM GMTBy: Mike_Shedlock

 In response to Reflections on the "Recovery" reader "Thomas" has an interesting question regarding U6 unemployment that I would like to share.
Thomas writes ...
Dear Mish,
Always look forward to your analysis. One small question. How many living, breathing, frustrated, suffering, hopeless, and poverty stricken actual human beings does the U-6 number 17.6% translate to? Thank you. Best Regards,
Thomas
Here is the chart in question once again.
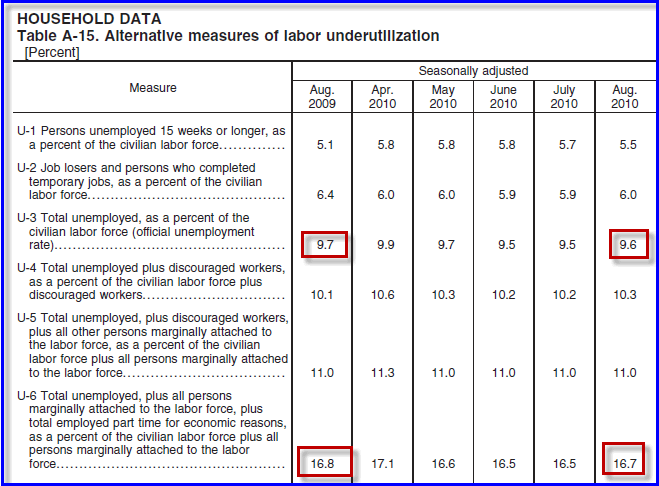
One year ago the official unemployment rate was 9.7%. Today it is 9.6%.One year ago U-6 unemployment was 16.8%. Today U-6 is 16.7%
For links to the actual numbers behind the percentages, please see Jobs Decrease by 54,000, Rise by 60,000 Excluding Census; Unemployment Rises Slightly to 9.6%; A Look Beneath the Surface.
Essential Math
Officially unemployed - 14.9 million unemployed
Marginally Attached Workers - 2.4 million
Part Time For Economic Reasons - 8.9 million
The total is 26.3 million but not all of the above are destitute or in poverty, even though the vast majority of them are suffering in some way.
Unfortunately, the total does not stop there because it does not include children or elderly. Both children and the elderly have been affected by the economic downturn, but neither reflects in unemployment stats.
Food Stamps
Most of the destitute are on food stamps (now called SNAP - Supplemental Nutrition Assistance Program to destigmatize the name).
According to SNAP, there are 41,275,411 on food stamps. However, that total is understated because it does not include the homeless. In addition, one must factor in AFDC (Aid to families with dependent children), Head Start, and numerous other state programs. One cannot add them all up because of obvious overlap.
Homeless
The Coalition for the Homeless addresses the question How Many People Experience Homelessness?
There are several national estimates of homelessness. Many are dated, or based on dated information. For all of the reasons discussed above, none of these estimates is the definitive representation of "how many people are homeless.” In a recent approximation USA Today estimated 1.6 million people unduplicated persons used transitional housing or emergency shelters. Of these people, approximately 1/3 are members of households with children, a nine percent increase since 2007. Another approximation is from a study done by the National Law Center on Homelessness and Poverty which states that approximately 3.5 million people, 1.35 million of them children, are likely to experience homelessness in a given year (National Law Center on Homelessness and Poverty, 2007).
These numbers, based on findings from the National Law Center on Homelessness and Poverty, Urban Institute and specifically the National Survey of Homeless Assistance Providers, draw their estimates from a study of service providers across the country at two different times of the year in 1996. They found that, on a given night in October, 444,000 people (in 346,000 households) experienced homelessness – which translates to 6.3% of the population of people living in poverty. On a given night in February, 842,000 (in 637,000 households) experienced homelessness – which translates to almost 10% of the population of people living in poverty. Converting these estimates into an annual projection, the numbers that emerge are 2.3 million people (based on the October estimate) and 3.5 million people (based on the February estimate). This translates to approximately 1% of the U.S. population experiencing homelessness each year, 38% (October) to 39% (February) of them being children (Urban Institute 2000).
It is also important to note that this study was based on a national survey of service providers. Since not all people experiencing homelessness utilize service providers, the actual numbers of people experiencing homelessness are likely higher than those found in the study, Thus, we are estimating on the high end of the study’s numbers: 3.5 million people, 39% of which are children (Urban Institute 2000).That was written in July of 2009. It is safe to assume the number is higher now. For the sake of argument let's assume the count is 3.5 million.
Dynamics of Poverty
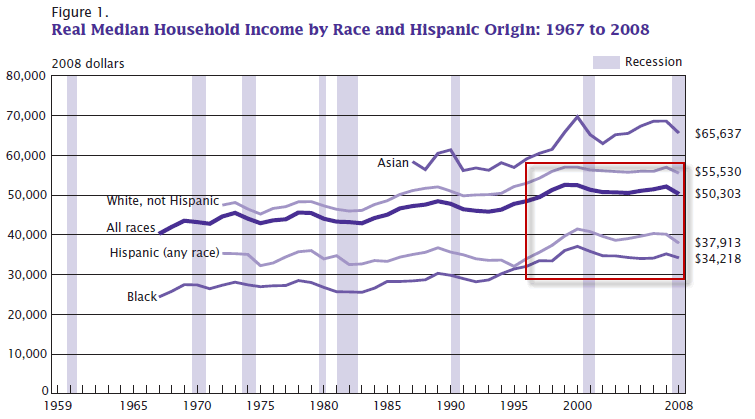
Here are a few snips from Income, Poverty, and Health Insurance Coverage in the United States: 2008
Approximately 31.0 percent of the population had at least one spell of poverty lasting 2 or more months during the 4-year period from 2004 to 2007.
Income in the United States
Real median household income declined by 3.6 percent between 2007 and 2008, from $52,163 to $50,303, following 3 years of annual income increases. The decline in income coincides with the recession that started in December 2007.
Real median income declined for both family (3.3 percent) and nonfamily households (4.0 percent) between 2007 and 2008.
Real median earnings of both men and women who worked full-time, year-round declined in 2008, following increases in 2007. Men’s earnings declined by 1.0 percent to $46,367 and women’s declined by 1.9 percent to $35,745. The 2008 female-to-male earnings ratio, 0.77, was lower than the 2007 ratio of 0.78.Median Household Income
Median household income was back at 1996-1997 levels for all but Asians. Bear in mind these numbers are for 2008! It is worse now.
I find the above snip in red astonishing: Approximately 31.0 percent of the population had at least one spell of poverty lasting 2 or more months during the 4-year period from 2004 to 2000
Politics and the Upcoming Election
All of the above stats are worse now than a couple years ago. Is it any wonder the population is madder than a hornet at politicians and the protected class of government workers and public unions, whose salaries and benefits have done nothing but go up, and up, and up, since 1996?
Please consider Voters Strongly Favor Non-Incumbent GOP Newcomers in Midterm Elections
The public is fed up with how beholden Obama is to unions. They are fed up with sacrifices they have to make that government workers don't. They are fed up with how well the political class has fared in this "recovery" vs. how well they have fared in this "recovery". They are fed up with never-ending wars.
It's not that people prefer Republicans by some huge margin. They don't. They specifically prefer non-incumbent Republicans hoping for a Change. Obama promised "Change you could believe in", but where is it? We are still bogged down in Afghanistan, Obama did not get us out of Guantanamo Bay as promised, but most importantly he did continue the same bailout strategies and surrounded himself with the same economic philosophy and same Wall Street advisors as Bush.
The public is fed up and rightfully so. The anti-union vote is going to be huge, and deservedly so.
I am increasingly confident that Republicans are going to take the House. So be prepared to Kiss Nancy Pelosi goodbye and be prepared to welcome John Boehner as the new House speaker. Perhaps we can get some real change. If not, gridlock is better than what we have seen under Obama.Returning to the original question, U6 does not directly translate to determining the number of frustrated, suffering, hopeless, and poverty stricken human beings affected by this economic slump. One must add up various numbers, taking care to not double count. One must also consider the fact that people go into and out of poverty, while others straddle the line, just beyond the threshold of being counted.
By Mike "Mish" Shedlock
http://globaleconomicanalysis.blogspot.com
Click Here To Scroll Thru My Recent Post ListMike Shedlock / Mish is a registered investment advisor representative for SitkaPacific Capital Management . Sitka Pacific is an asset management firm whose goal is strong performance and low volatility, regardless of market direction.
Visit Sitka Pacific's Account Management Page to learn more about wealth management and capital preservation strategies of Sitka Pacific.
I do weekly podcasts every Thursday on HoweStreet and a brief 7 minute segment on Saturday on CKNW AM 980 in Vancouver.
When not writing about stocks or the economy I spends a great deal of time on photography and in the garden. I have over 80 magazine and book cover credits. Some of my Wisconsin and gardening images can be seen at MichaelShedlock.com .
© 2010 Mike Shedlock, All Rights Reserved.
© 2005-2022 http://www.MarketOracle.co.uk - The Market Oracle is a FREE Daily Financial Markets Analysis & Forecasting online publication.