Recession, Depression, or Recovery, Gold Continues to Boom
Commodities / Gold and Silver 2010 Sep 08, 2010 - 02:44 AM GMTBy: Q1_Publishing
 As gold nears new all-time highs, a minority of investors is in it, more are waiting for a dip, and most will miss out on it altogether. Well, until the top when everyone will be herding into it.
The case for gold is a simple one. But today we’ll look at why the gold boom has much more room to run and how historical evidence shows there isn’t much time to “weight” to get in.
The Long Boom in Gold
All the fundamentals are in place in place for the gold bull run to continue well into the future.
The U.S. budget deficit is likely to be much worse than predicted.
In Too Much Hope and Audacity, we found the government’s deficit forecasts to be a bit too optimistic. Although they called for a cumulative $9.7 trillion budget deficit over the decade, further analysis revealed it was a “best case” scenario. The official forecast included expiration of the Bush tax cuts, no recession in the next 10 years, and a greatest hiring boom in the past fifty years. As a result, the 10 year deficit is likely to exceed the $9.7 trillion estimate.
Also, deflation has the Fed very concerned. The Fed is, at a minimum, going to keep rates at or near zero for a long time to come. That means real interest rates will likely be negative, which in The “Real” Reason it’s too Early to Bet Against Gold we show why that will keep gold prices moving higher.
Finally, there’s a much bigger driver for gold: gold is still an outside-the-mainstream investment class.
Great Things Come to Those Who “Weight”
The main reason gold has the most upside potential of any asset class is simply because so few people own it or have any exposure to it.
Remember, bubbles are driven by the masses herding into a specific investment class. The tech bubble was created by a record number of Americans owned stocks. The housing bubble was driven by the percentage of households that owned a home reached its highest point in history. The current “bond bubble” – where the U.S. government can borrow money for 10 years at 3% - has been driven by investors dumping stocks and buying bonds at a record rate.
The gold bubble will be no different. At this point however, owners of gold and gold stocks are still very much the minority.
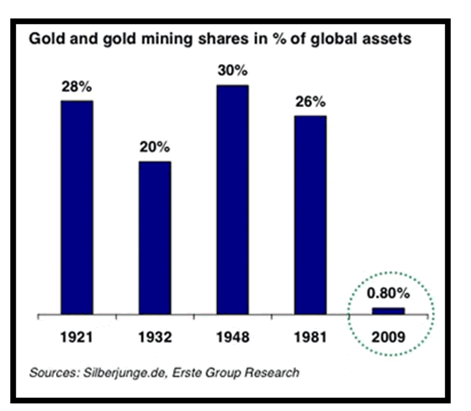
The chart below, courtesy of BusinessInsider.com, shows how much room there is left to move in the gold bull market:

As you can see, gold sector investments – from bullion to gold mining stocks – make up a tiny fraction of the investment world’s portfolios right now.
This proves gold is still a non-mainstream-asset class.
Better yet, when we look at the history of bubbles, it shows gold prices can go much, much higher.
History is Rhyming
The major bubbles of the past 30 years have all been dominated by one theme: at their peaks, the bubble asset class makes up a substantial portion of most investors’ portfolios.
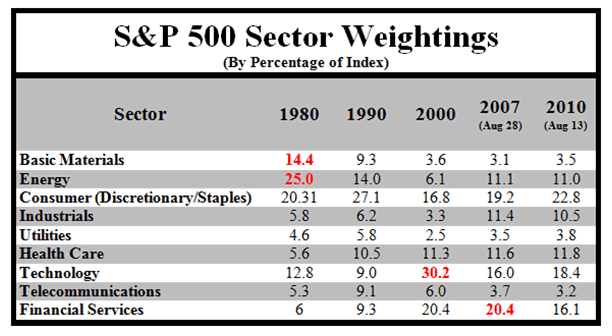
The table below shows the past three major asset bubbles and how the bubble sector made up an outsized portion of the overall market:

The oil/hard assets bubble of the late 70s culminated in 1980. At the time the energy sector made up more than 25% of the S&P 500. That was more than four times higher the level when the energy sector hit rock bottom in 2000.
The tech bubble peaked around the turn of the century. Tech stocks made up more than 30% of the S&P 500. That was almost triple the average weighting sector for the previous 20 years.
The credit bubble peaked when banks accounted for more than 20% of the S&P 500. That was more than triple its percentage in 1980.
There’s a clear pattern here signaling there’s a lot more upside for gold since they still make up a tiny fraction of investors’ portfolios worldwide.
It’s impossible to say whether gold will reach the 20%+ barrier that marked other bubble tops. The pattern, however, shows bubble assets tend to grow three to four times larger on a relative basis than their long-run averages. So it’s not too hard to see where gold and gold stocks as a percentage of investors’ assets will triple or quadruple from here.
Gold Bubble: The Biggest Yet
As gold prices continue to rise, we’ll keep in mind the key foundation for bubbles – low interest rates.
The Fed’s response to the Asian currency crisis and Russian debt default fueled the tech bubble.
The Fed’s response to the tech bust was created the even bigger housing/financial bubble.
This time around the Fed’s unprecedented actions will inevitably create another bubble that will be even bigger.
As we said in our free gold report before the stocks in went up more than 1600% in six months (get your free copy here), every few decades though, the right conditions come along to make an absolute fortune in gold and gold stocks. Right now the conditions are right.
Good investing,
Andrew Mickey
Chief Investment Strategist, Q1 Publishing
Disclosure: Author currently holds a long position in Silvercorp Metals (SVM), physical silver, and no position in any of the other companies mentioned.
Q1 Publishing is committed to providing investors with well-researched, level-headed, no-nonsense, analysis and investment advice that will allow you to secure enduring wealth and independence.
© 2010 Copyright Q1 Publishing - All Rights Reserved
Disclaimer: The above is a matter of opinion provided for general information purposes only and is not intended as investment advice. Information and analysis above are derived from sources and utilising methods believed to be reliable, but we cannot accept responsibility for any losses you may incur as a result of this analysis. Individuals should consult with their personal financial advisors.
© 2005-2022 http://www.MarketOracle.co.uk - The Market Oracle is a FREE Daily Financial Markets Analysis & Forecasting online publication.


