Monday Stock Market Movement - Mind the (Wealth) Gap!
Stock-Markets / Financial Markets 2010 Sep 20, 2010 - 12:56 PM GMTBy: PhilStockWorld

 Congratulations to 440,000 of us!
That’s how many people became Millionaires in the past 12 months (ending in June). According to a new survey from Phoenix Marketing International’s Affluent Market Practice, the number of American households with investible assets of $1 million or more rose 8% in the 12 months ended in June. The survey says there now are 5.55 million U.S. households with investible assets of $1 million or more. That follows two years of declines and brings the Millionaire count back to 2006 levels. Of course, that is still below the peak of 5.97 million in 2007 and the current growth rate is well below pre-financial crisis levels, when the Millionaire population increased as much as 35% a year.
Still, the numbers offer further evidence that the wealthy may have decoupled from the rest of the economy, as we expected would happen in "A Tale of Two Economies," my 2010 outlook. The study’s authors say high salary growth, rather than investments, are the main drivers of the Millionaire expansion. As we who play the markets are painfully aware, $1M in assets doesn’t leave a lot of room for investments. The very wealthy, on the other hand, had a much better year than the mere Millionaires. The population of American households with $5 million or more in investible assets surged 16%. The population of those with $10 million to invest increased 17%. The rich have never been getting richer than they have been in 2010!
Of course, in order for someone to get rich, someone has to get poor and, this year it took 4M Americans falling below the poverty line ($22,000 for a family of 4) to provide the cash for our 440,000 winners. That’s pretty much right in line with the numbers I’ve been citing over and over again - it takes 1,000 poor people to make one rich one!
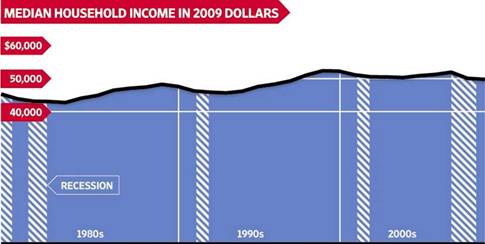
The Census Bureau found that the fraction of Americans living in poverty rose sharply to 14.3% in 2009, up from 13.2% previously. This is the highest level since 1994. In total, 43.6 million Americans were living in poverty last year. Even the median family is getting the shaft in America with 2010 inflation-adjusted salaries barely keeping pace with 1980 inflation-adjusted salaries - making 3 full decades without improvement for the average American family. According to the WSJ, the bottom 40% (120M people) have dropped from having 14.5% of the nation’s income in 1980 to having 12% in 2010, a 30-year decline of 17.3% while the top 5% (15M people) gained 31%, with their share of the Nation’s wealth rising from 17.5% to 21.7% of all income.
Where did the rest of the money come from, if not the poor? Why from the Middle Class, of course - but you won’t see that chart in the Wall Street Journal, will you? Another chart you won’t see in the WSJ is the, which indicates how much money each income group got from the Bush Tax Cuts since 2004. Not at all surprising, the bottom 95% got, at the top of that group, $4,000 a year off incomes between $100,000 and $200,000, while the top 0.1% got tax cuts of $464,000 PER YEAR - 1,000 TIMES MORE, ON AVERAGE than the bottom 95% got and 100 times more than even the bottom of the top 5% were given.
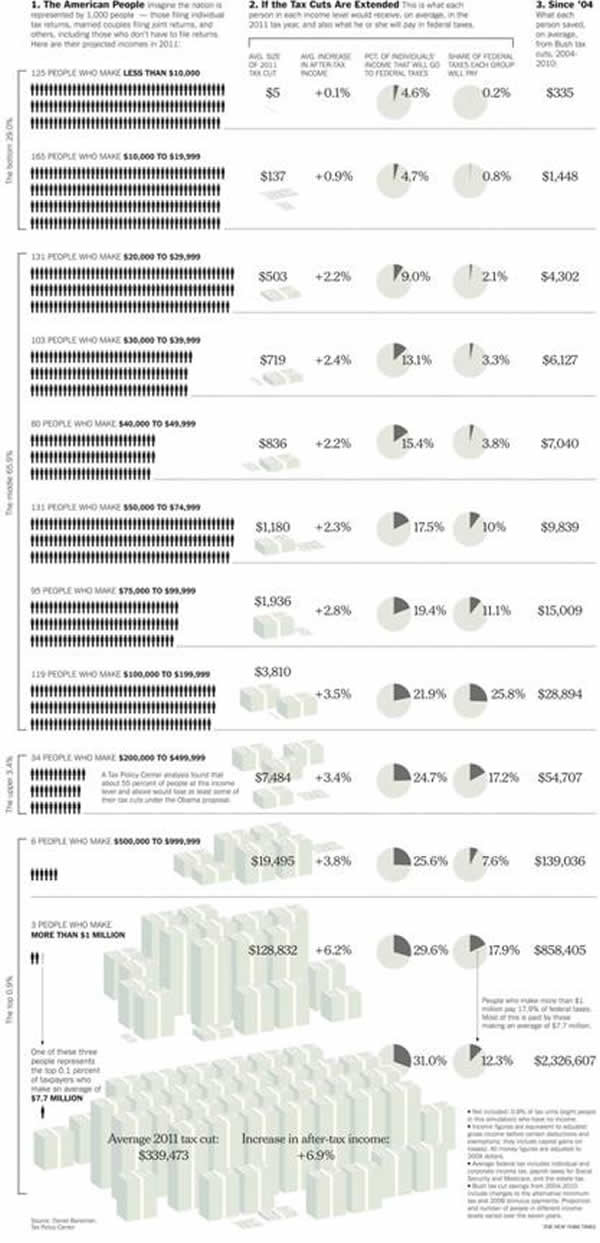
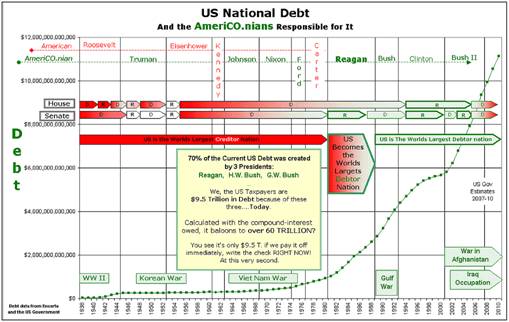
So the six-figure salary-man gets a $4,000 tax break while his boss gets a tax break that equals his ENTIRE salary for FIVE years! Meanwhile, the government goes in debt to pay for the tax breaks and that debt is distributed EQUALLY on a per-person basis so the salaryman’s family debt climbed from $80,000 in 2002 to $160,000 in 2009 ($12,000 per year) in order to pay for the $28,000 tax break he got and the $2,326,000 tax break his boss got.
Interestingly, even the NY Times neglects to take into account the cost of tax breaks given to Big Business, who have done far more to impoverish the bottom 90% of this country than a Million Millionaires could ever do, paying just $138Bn (6.3%) in total taxes in 2009 while earning 60% of all income. What’s disturbing about this is there is a fallacy of measuring debt to GDP ratios in determining the economic health of nations but if that GDP is being distributed unequally and the the debt is being distributed equally, then the burden of debt becomes a crushing obligation to the poor (the bottom 95%) that can never be repaid while the top 5% can simply (as they often threaten to do) relocate to a country that hasn’t gone deeply into debt in order to make them rich (yet).
With 45M people now living below the poverty line in America, it’s no wonder the GOP has their sites set on slashing aid to the poor as it gets pretty expensive to feed all these people and stop them from dying, etc. According to the WSJ, House Republicans are planning to chip away at the White House’s legislative agenda—in particular the health-care law—by depriving the programs of cash.
Republican leaders are also devising legislative maneuvers that might have a bigger impact, using appropriations bills and other tactics to try to undermine the administration’s overhaul of health care and financial regulations and its plans to regulate greenhouse gases. GOP leaders also hope to trim spending, return unspent stimulus funds and restore sweeping tax cuts.
"We need to establish the proverbial lines in the sand and show we are serious about limited government," said Wisconsin’s Rep. Paul Ryan, a leading conservative who is in line to chair the House budget committee if Republicans take control. Republican congressional aides and advisers say their focus would including blocking funding to hire new Internal Revenue Service agents, who are needed to enforce the law’s tax increases. They also would consider barring spending for a new board that approves Medicare payment cuts as well as on research that compares the effectiveness of medical procedures. "By having the capacity to block funding for it, you get to very much shape how it turns out," said Douglas Holtz-Eakin, a director of the Congressional Budget office under Mr. Bush.
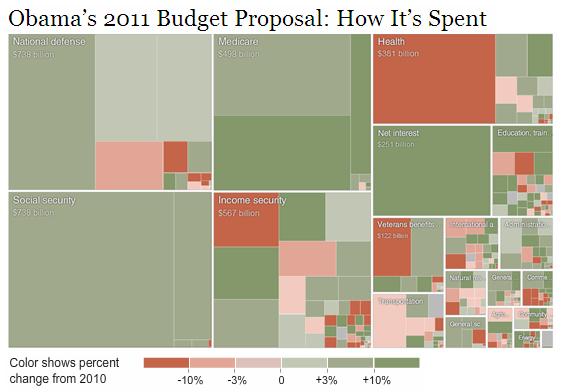
De-funding health care and blocking other attempts by the administration to provide relief to poor and middle class families is only a dress rehearsal for the Big Kahuna, the complete de-funding of Social Security and Medicare, measures that would free $1.2Tn from our budget to enable even larger tax cuts for the top 1%, possibly eliminating the need for them to pay taxes altogether, which will allow them to trickle down on the rest of the population as they see fit and restore America to the glory of the mid-2000s!
The investing class is, of course, encouraged by this turn of events and with the polls making it seem likely that the Republicans will be able to take control of at least the house, we can expect more of the same for the next two years at least. That means that it will be time to take a look again at the things that worked well under Bush like betting on commodity prices to skyrocket with $100 oil and $4 copper. Investment banking may come back in vogue as the ultra-rich need somewhere to park all their money and labor-intensive businesses like WMT and MCD get a double benefit of millions more people being unemployed and a general lack of money for the working class driving them to the lowest-cost providers. This is, of course, also great for China, who make all those happy meal toys and most of the stuff in WMT and their economy should do very well as we shift another 10M jobs overseas with no changes in the current tax laws that encourage this behavior.
 In Goldman Sachs’s US Portfolio Strategy, David Kostin now sees the same toppy action we called last week and is shifting his allocations to a more defensive stance "in anticipation of slowing economic growth indicators." As I said last week, our big worry this week is housing and we get plenty of housing data starting with this morning’s NAHB Market Index at 10. Tomorrow we get Housing Starts and Building Permits before the bell, followed by the FOMC Rate Decision at 2:15, which is always a fun market mover even though the rate itself doesn’t budge. Thursday we need to show less than 450,000 jobs lost for the week and we get Existing Home Sales at 10 along with Leading Economic Indicators and Friday we get Durable Goods along with New Home Sales, which are likely to set a new record low around 270,000 or one replacement home per 407 existing homes in a year!
Obama is going to say some stuff at a town hall meeting today and the news was quiet this weekend so we’ll just be watching the same old levels as last week to see which way the wind is blowing. Japan popped 1.25% this morning and the BSE was up 1.6% to 19,906 but the Hang Seng and Shanghai were flat and Europe is up half a point ahead of our open so we remain cautiously optimistic as long as we hold our 4% lines because, after all, WE ARE the investing class and dunking another 10-20M people below the poverty line next year means that another 10-20,000 of us get to be Millionaires so we’ll keep our eye on that prize as we fiddle away while Rome burns all around us…
Happy investing,
By Phil
Philip R. Davis is a founder of Phil's Stock World (www.philstockworld.com), a stock and options trading site that teaches the art of options trading to newcomers and devises advanced strategies for expert traders. Mr. Davis is a serial entrepreneur, having founded software company Accu-Title, a real estate title insurance software solution, and is also the President of the Delphi Consulting Corp., an M&A consulting firm that helps large and small companies obtain funding and close deals. He was also the founder of Accu-Search, a property data corporation that was sold to DataTrace in 2004 and Personality Plus, a precursor to eHarmony.com. Phil was a former editor of a UMass/Amherst humor magazine and it shows in his writing -- which is filled with colorful commentary along with very specific ideas on stock option purchases (Phil rarely holds actual stocks). Visit: Phil's Stock World (www.philstockworld.com)
© 2010 Copyright PhilStockWorld - All Rights Reserved Disclaimer: The above is a matter of opinion provided for general information purposes only and is not intended as investment advice. Information and analysis above are derived from sources and utilising methods believed to be reliable, but we cannot accept responsibility for any losses you may incur as a result of this analysis. Individuals should consult with their personal financial advisors.
© 2005-2022 http://www.MarketOracle.co.uk - The Market Oracle is a FREE Daily Financial Markets Analysis & Forecasting online publication.


