


Stock Market Topsy-Turvy Session Ends Lower
Stock-Markets / Stock Markets 2010 Sep 24, 2010 - 02:19 AM GMTBy: Harry_Boxer

 The stock market indices had a topsy-turvy session, opening sharply lower, rallying immediately, and retesting the earlier week's highs on Nasdaq 100 over 2000 at the 2002.50 level. The S&P 500 at that point had rallied back up to 1137, but it was nearly 12 points below Tuesday's high, and the negative divergence caused the indices to back off and consolidate.
After an hour and a half or so, after forming what appeared to be bull flags, the indices failed and rolled over hard and got slam-dunked down to retest the lows. The last 25-30 minute snapback rally pared back the losses.
Net of the day, however, was a loss for the indices, with the Dow down just 76.89 at 10,662.42. The S&P 500 dropped 9.45 at 1124.83, and the Nasdaq 100 lost just 0.61 at 1982.15, 20 points off its high.
Advance-declines were 21 to 9 negative on the New York Stock Exchange, and about 2 to 1 negative on Nasdaq. Up/down volume was 3 1/2 to 1 negative on New York on total volume of under a billion at 938 million shares. Nasdaq had an 11 to 7 negative plurality on total volume of nearly 1.9 billion shares traded today.
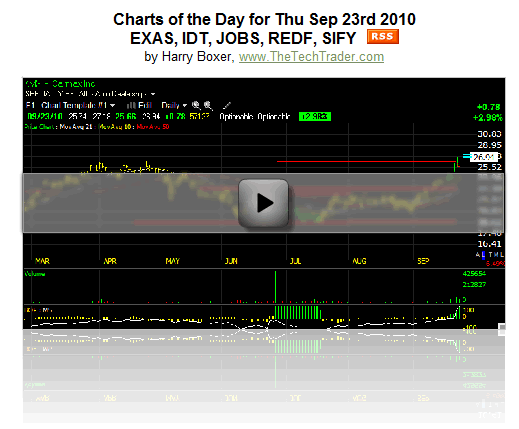
Charts of the Day:
Today I'm going to talk about several stocks that we've highlighted recently as swing trades and a few other emerging ones.
Exact Sciences Corporation (EXAS), a recent swing trade pick which has moved very nicely from the 5.00 range to 6 3/4, has reached two of my trading targets at 6 1/4 and 6 3/4. It backed off this morning at 6.16, but came on again, and closed up 26 cents, or 4%. Looks like this is not done yet. New target now is around 7 3/4.
IDT Corporation (IDT), in a beautiful rising channel for the last year, at this point appears like it's coming out of the coil pattern that it was consolidating in, and over the last four days it's moved up steadily, from 15 1/2 up to as high as 18 1/2 today, reaching a resistance zone and backing off. My opinion is that this will be taken out, and then the stock will move into the low 20s for my short-term trading target. Mid-to-high 20s intermediate target.
51job Inc. (JOBS) exploded through the 29 1/2-30 zone. We added it as a swing trade and this stock has now moved up about 8 points and fulfilled our trading target on the short-term basis, but still it doesn't show any signs of letting up. We may see something in the low-to-mid 40s very shortly.
Rediff.com India Ltd. (REDF) has had an explosive move in the last two and a half weeks, moving from 2.00 to nearly 6.00 today, reaching 5.89, up another 86 cents, or 17.7%. You can see this stock has got very strong momentum short-term. It's gone through two layers of resistance. The third target, and what I'd call swing trade possibilities, is up around 6.90 to 7.25, in that zone. If it reaches there, that will be a place, maybe, to consider exiting short-term.
Sify Technologies Limited (SIFY) has been moving of late, going from 1.27 to 2.43, and it looks like my target at 2 3/4 may be met very shortly. Step back and look at the overall pattern and you'll see that the long-term down channel was broken, lateral price resistance was taken out, retested, and then popped, moving through that 2.75-2.90 zone. I could see this stock at 4.00 - 5.00.
Reviewing our Watchboard:
TheTechTrader.com board was mixed and mostly lower, with quite a few gainers on our board today, several of which we traded. Leading the way, Amtech Systems Inc. (ASYS), a current swing trade pick of ours, was up 1.19 to 17.20. Endo Pharmaceuticals Holdings Inc. (ENDP) jumped 92 cents to 29.74. Savient Pharmaceuticals, Inc. (SVNT) gained 99 cents to 22.84, and Rediff.com (REDF) added another 81 cents to 5.65.
In addition, Limelight Networks, Inc. (LLNW) advanced 48 cents to 4.90, IDT Corporation (IDT) 45 cents to 17.96, VirnetX Holding (VHC) 62 cents to 12.84, Green Plains Renewable Energy (GPRE) 38 cents to 10.95, Aspen Technology Inc. (AZPN) 55 cents to 9.88, and VirnetX Holding Corp (VHC), a current swing trade pick, 62 cents to 12.84. Exact Sciences Corporation (EXAS), another swing trade pick, gained 26 cents to 6.50, with Biovail Corporation (BVF) up 89 cents to 26.75.
In the large-cap sector, slight gainers included Amazon.com Inc. (AMZN) up 1.02 to 152.85, and Apple Inc. (AAPL) up 1.17 to 288.92, about 4 points off its high. The Direxion Daily Small Cap Bear 3X Shares (TZA) rose 1.03 to 29.61.
On the downside losses included Goldman Sachs (GS) down 3.16 to 144.91, JinkoSolar Holding Co., Ltd. (JKS) down 1.20 to 29.25, Valassis Communications Inc. (VCI) 1.05 to 32.01, and the Direxion Daily Financial Bull 3X Shares (FAS) 1.12 to 20.67.
Stepping back and reviewing the hourly chart patterns, the indices were down at the opening, rallied very sharply in the morning, consolidated mid-day, and then rolled over hard and sold off to retest the lows, but bounced in the last half hour to pare back the losses. Still, a negative session for the indices, and the S&P 500 remained in the confines of its newly forming 3-day down channel.
We'll see what kind of further downside follow-through we get, or whether they can hold support and bounce them back.
Good Trading!
Harry
For more of Harry Boxer, sign up for a FREE 15-Day Trial to his Real-Time Technical Trading Diary. Or sign up for a Free 30-Day Trial to his Top Charts of the Week service.
(c) 2010 AdviceTrade, Inc. All rights reserved. Distributed only by written permission of AdviceTrade and The Technical Trader at info@advicetrade.com . In using any portion of Harry Boxer's content, you agree to the terms and conditions governing the use of the service as described in our disclaimer at http://www.thetechtrader.com
Mr. Boxer's commentaries and index analysis represent his own opinions and should not be relied upon for purposes of effecting securities transactions or other investing strategies, nor should they be construed as an offer or solicitation of an offer to sell or buy any security. You should not interpret Mr. Boxer's opinions as constituting investment advice. Trades mentioned on the site are hypothetical, not actual, positions.
Harry Boxer Archive |
© 2005-2022 http://www.MarketOracle.co.uk - The Market Oracle is a FREE Daily Financial Markets Analysis & Forecasting online publication.