


Partial Equilibrium Analysis – Part 2
Economics / Economic Theory Sep 24, 2010 - 12:22 PM GMTBy: Andy_Sutton

 In the first part of this series, we took at a look at Partial Equilibrium (PE) analysis in terms of analyzing a particular good or service rather than macroeconomic aggregates. What PE allows us to do as well is to both qualitatively and quantitatively assess the true effects of taxes and subsidies. We can also answer whether or not taxes and subsidies represent Pareto efficiencies. For our example we chose to look at the area of gasoline taxes. Many state governments are considering increasing gasoline taxes in the face of collapsing tax receipts. Intuitively, it would seem that such measures would be penny-wise and dollar foolish, but let’s use PE and see if that bears out conventional wisdom.
We’re going to also take it a step further and add an externality to our analysis: reserves depletion. Peak oil has been talked about in many forums, including military think tanks, World Bank whitepapers, and countless other places. We’ll take a look at efficiency and how it is affected by the lack of internalization by energy producers and consumers.
The first conclusion that we were able to arrive at last time is the fact that non-intervention (zero taxes / subsidies) market equilibrium are Pareto efficient, that is to say that Total Net Social Benefit (TNSB) is maximized. This fits the criteria for being Pareto efficient since any other combination would result in certain parties being made better off at the expense of other parties.
In the non-intervention equilibrium, there are only two types of surpluses – consumer and producer. There were no other parties involved. Certain economic agents produced the goods, while others consumed them. However, in the situation where there is a tax or subsidy (in this case a proposed tax), the government is now put into the mix and its impact on equilibrium must be studied. When the government collects a tax, it now has a surplus, which otherwise would have accrued to either producers or consumers. We’ll call the government’s new windfall GS.
The bottom line in any tax situation is that consumers are now short GS. In the most simplistic terms, GS could be returned to the consumers and a return to Pareto efficiency would be observed. Obviously GS has not disappeared; it is still available to society. This is where the rhetorical question of who spends your money better comes from.
In the following chart, note that equilibrium is present at Pm and Qm. When the government imposes a tax (let’s insert our proposed gasoline taxes in here), the price of gasoline is shifted to Pc, with producers collecting Pp. The new quantity produced/traded is Qd. This new reality reflects consumers’ lack of willingness to consume at the equilibrium quantity since they’re facing higher prices. It must be noted that elasticity of demand will determine exactly how much less they’re willing to consume, but for the purposes of this discussion, let’s assume that demand and supply are both linear functions.
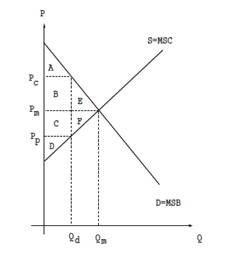
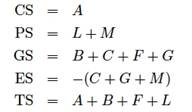
In the situation where the tax is collected, consumers will lose surplus because they are paying more for what is consumed. Producers are losing surplus because they receive less for what they sell. The government generates a surplus because it collected the tax. Let’s take a look at the welfare calculations:
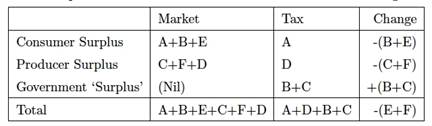
It is obvious from the welfare analysis that the equilibrium was economically efficient while the new tax equilibrium is not because the total welfare is lower under the tax equilibrium than the market equilibrium. Put another way, the change in total welfare from the new tax is negative, indicating that the tax is not economically efficient. –(E+F) is often referred to as a welfare loss in general economics classes.
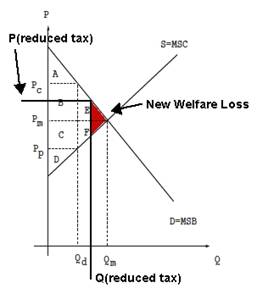
Conversely, let’s think about the affect of reducing a tax. Let’s say we reduced the tax by 40%. We’d now see equilibrium re-appear at new price level P(reduced tax) and the new quantity at Q(reduced tax). The new –(E+F) or welfare loss would be considerably smaller than at the original tax level. In this case, the total welfare would have increased from the level of the original tax levy, but would still not be Pareto efficient since it would still be less than market equilibrium.
PE with Externalities
Obviously with peak oil on the mind of most people, it pays to take a look at partial equilibrium with a negative externality, namely overproduction, in this instance. In our prior example, we had several classes of surpluses: consumer, producer, and government. Now, we’ll add a fourth economic agent, albeit a non-acting agent, in the form of petroleum reserves. It is important to note up front that we are not in any way trying to estimate the degradation of any specific resources, but merely to show how efficiency towards reserves will be affected by other intransigent policy.
In our example, we’ll label our variables CS, PS, GS, and ES for consumer surplus, producer surplus, government surplus, and externality surplus. The total welfare or TNSB will be the sum of these four surpluses. We can then further deduce that the change in TNSB (∆TNSB) will be the sum of the changes of the four surpluses. ∆G will merely be (R-S) revenue minus subsidy or spending. ∆E will be the change of petroleum reserves.
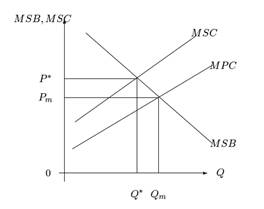
In the above chart MSC represents the marginal social cost, and MPC represents the marginal private cost. The difference here between the MSC and MPC represents the ∆ES or depletion of reserves in this case. The case where MSC intersects MSB is the efficient outcome from the standpoint of the depletion externality, and the intersection of MPC and MSB is the market equilibrium. It is fairly obvious in this case that consuming at the market equilibrium entails inefficiency in terms of reserves depletion. Again, any consumption is obviously going to diminish reserves, however, we’re searching for the most efficient mix of production and consumption.
Let’s take a look at total welfare and see what we get in terms of adding this very important externality to the equation.
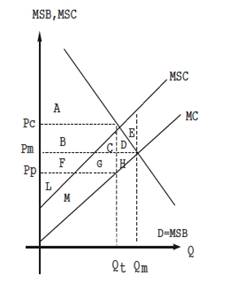
In the case of petroleum, taxes can actually serve to bring MSC and MPC (MC) into line, meaning that in effect, taxes can make actual production equal the optimal from both a cost and depletion perspective. However, too high of a tax will obviously be inefficient as well. In our case, graphically, the tax would need to be precisely the difference between MSC and MPC (MC) in the above chart. This would serve to reduce production and consumption to the point where utilization was optimal.
Let’s look at the total welfare analysis:
Surpluses in the presence of the tax:
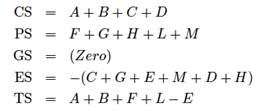
Surpluses at market equilibrium:
Welfare analysis (Sum of changes in all surpluses):
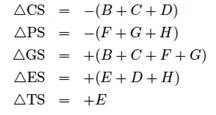
With the externality in place, less oil is produced, less damage is done to reserves, and TNSB is maximized with a tax equal to the different between MSC and MPC in place.
Summary and Conclusions
Consumers and producers both generally prefer the market equilibrium and, minus externalities, the market equilibrium is the most efficient as measure in Pareto terms. Taxes in such a situation will cause immediate dislocations and will not be efficient. However, in cases where there are externalities, taxes can be useful for bringing the monetary costs and the net social costs into line. We can easily conclude that imposing a gasoline tax merely for the purposes of increasing revenue is inefficient because the intent is not to bring monetary and social costs in line, but rather is arbitrary and capricious in nature. Further analysis could easily glean whether or not the actual taxes collected were efficient or not. The example of using depletion of petroleum reserves is key since taxes can actually help to make our use of this wasting asset more efficient. However, simply applying additional revenue-generating taxes on the purchase, consumption, or the byproducts of oil are not economically efficient, and while they may prolong reserves a bit further, there will be other economic costs that will be greater than the benefits accrued.
References: Primer on PE: R. Wigle, Microeconomics: J. Perloff, Economics and Public Policy: J. Kearl.
By Andy Sutton
http://www.my2centsonline.com
Andy Sutton holds a MBA with Honors in Economics from Moravian College and is a member of Omicron Delta Epsilon International Honor Society in Economics. His firm, Sutton & Associates, LLC currently provides financial planning services to a growing book of clients using a conservative approach aimed at accumulating high quality, income producing assets while providing protection against a falling dollar. For more information visit www.suttonfinance.net
Andy Sutton Archive |
© 2005-2022 http://www.MarketOracle.co.uk - The Market Oracle is a FREE Daily Financial Markets Analysis & Forecasting online publication.