Gold Rally could run out of steam in the near term
Commodities / Forecasts & Technical Analysis Jan 18, 2007 - 08:30 PM GMTBy: Clive_Maund
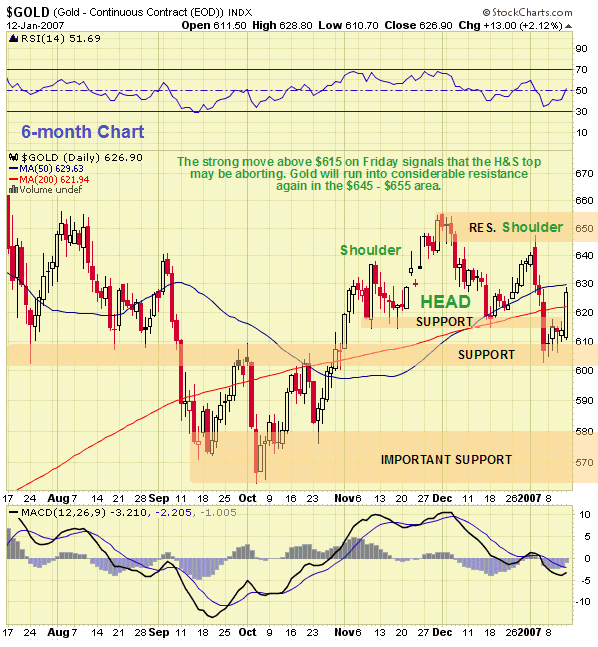
We have seen the severe smackdown anticipated in the last Gold Market update, although it did first manage to trip our overhead stops by a whisker before plummeting. This resulted in a breakdown from the intermediate Head-and-Shoulders top area shown on the 6-month chart. On Friday, however, it surged back above the "neckline' of this pattern, which is close to aborting. Although Friday's rally was certainly impressive, we are definitely not out of the woods yet, as will be readily apparent when we look at the 6-year gold chart.
The strength of the move on Friday implies that we will see follow through over the next week or so, with a few down days thrown in. However the advance is likely to be capped once it reaches the $645 - $655 area, where there is substantial resistance - if it succeeds in getting that far. We will then need to review it in the light of what is going on in the T-bill and T-bond market and the dollar, with a view to possibly shorting it again.

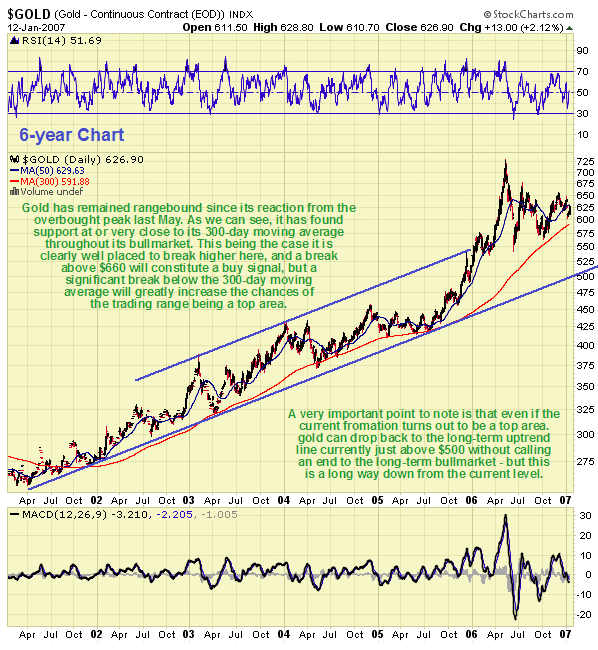
The 6-year chart is worth studying at this pivotal juncture, as it puts recent action into perspective. On this chart it is clear that gold is playing its hand very close to its chest, for the formation that has developed following the top last May could be either a consolidation pattern leading to renewed advance, or a top area to be followed by decline back to the long-term uptrend line, which would not necessarily mark the end of the bull market, but would be highly unwelcome to those long the sector. "What a great help this guy is!" I can hear you saying, "he thinks the market could either go up or down - a fence sitter." If that is what you are thinking then there are 2 things that should be pointed out. The first is that sitting on the fence is actually the wise thing to do in certain situations, because you retain the option of jumping down from it on either side, once you have figured out where the grass is greener. Secondly, on www.clivemaund.com we definitely did not sit on the fence at the start of the year when we shorted gold and silver, and closed out our positions last Wednesday - Thursday, and successfully exited highly profitable option trades. Gold permabulls at best achieved nothing during this period.

Let's now consider further the long-term gold chart. As is readily apparent with the benefit of hindsight, gold got wildly overbought last April-May, as indicated by the huge gap with its moving averages, regardless of whether the large trading range that has since developed is a consolidation pattern or a top area. Notice that the long-term moving average appended to this chart is a 300-day, instead of the customary 200-day. This is because this moving average time period provides a better fit than the 200-day. Observe how gold has found support at or very close to this average throughout its bull market. On the basis of the fact that gold has now corrected back close to this average, and is now not far above it, it is clearly well-placed to break higher again soon, although this in itself does not mean it is going to.
 BullionVault.com is currently giving a FREE gram of Swiss vaulted gold bullion to everyone who registers (worth $24)- to try the service and learn how to trade. Sign-up is easy, fast and credits you immediately.
Considering both this 6-year chart and the 6-month chart above we can see that a breakout above the December high in the $655 area would greatly increase the chances of a powerful upleg developing, and therefore a break above $660 will be viewed as a buy signal with close stops. Bears would argue, on the other hand, that the spike last April-May was a climactic blowoff move that has been followed by the development of a large top area, and that gold should now react back at least to the long-term uptrend line, currently just above $500, which would be a substantial drop from current levels. The signal for such a decline would be a significant breach of the 300-day moving average, as would be occasioned if the price dropped back to the $575 area.

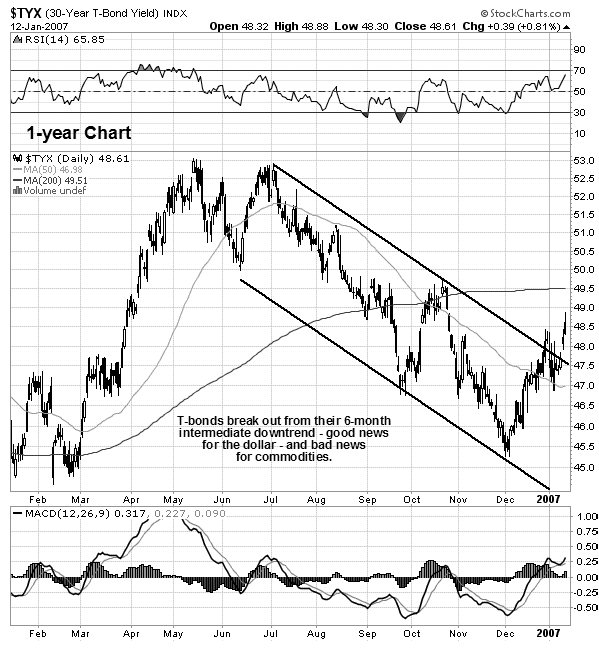
The bears have a powerful case right now. The year has started with commodities going into a tailspin. Copper has broken down from a top area, Oil has broken down from its long-term uptrend, even though it now looks set to rally from oversold. T-bills and T-bonds are breaking out of their intermediate downtrends in force since last July, which can be expected to fuel a continued rise in the dollar. So if you were to force me to come down from the fence on one side or the other right now it would be on the bearish side, although I would quickly leg it back over to the other side in the event that gold breaks above $660.
Conclusion: the current short-term rally is expected to continue to the $645 - $655 area, where there is considerable danger of gold turning lower again, thus it should be considered for shorting in this zone with a close overhead stop. Gold is a buy for a potential major uptrend in the event of it breaking above $660. A break below support at $600 can be expected to lead to a test of the important support in the $575 area. If support in this area fails gold can be expected to retreat back to the support of the long-term uptrend in the $500 - $510 area, but as long as this trendline holds the gold bull market lives on.
By Clive Maund
CliveMaund.com
The above represents the opinion and analysis of Mr. Maund, based on data available to him, at the time of writing. Mr. Maunds opinions are his own, and are not a recommendation or an offer to buy or sell securities. No responsibility can be accepted for losses that may result as a consequence of trading on the basis of this analysis. Mr. Maund is an independent analyst who receives no compensation of any kind from any groups, individuals or corporations mentioned in his reports. As trading and investing in any financial markets may involve serious risk of loss, Mr. Maund recommends that you consult with a qualified investment advisor, one licensed by appropriate regulatory agencies in your legal jurisdiction and do your own due diligence and research when making any kind of a transaction with financial ramifications.
© 2005-2022 http://www.MarketOracle.co.uk - The Market Oracle is a FREE Daily Financial Markets Analysis & Forecasting online publication.


