Stock Market Confounds Press and BlogosFear September Plunge Fears By Closing Up 8%
Stock-Markets / Stock Markets 2010 Sep 30, 2010 - 06:37 PM GMTBy: Nadeem_Walayat
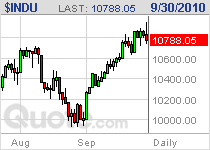
 The stock market rallied during september right from the start of the month without any significant reactions against a solid uptrend that saw the Dow close at 10,788 (up 7.7%) which is contrary to the mainstream press and the BlogosFear mantra of first having pumped investors full of hindenberg crash omen fears during much of August, which then continued to scream Fear in a near relentless mantra for the whole of September by dredging up historic precedents that September is usually one of the worst months for stocks and therefore investors should seek to sell ahead of an anticipated slump or worse as illustrated below that NEVER materialised:
 September the Worst Month for Stocks - ABC News - 31st August 2010
SEPTEMBER SLUMP: September is historically the worst month in the market and one of only three, along with February and June, when stock prices typically decline. The Standard & Poor's 500 index has declined an average of 0.6 percent in Septembers since 1950.
WHY THE SELLOFFS? Mutual fund managers tend to clean up their portfolios and sell stocks after Labor Day, and workers back from summer vacations are inclined to sell as they get their financial affairs in order. Some of the reason is psychological.....
Investors Get Superstitious For A September Slump In Stocks... - Wall Street Journal - 31st August 2010
For those superstitious, the next 30 days mark what traditionally is the worst month of the year for stocks. There's evidence going back 100 years that September has been cruel to the Dow Jones Industrial Average, including the market collapse at the height of the financial crisis two years ago and in the days after the Sept. 11 attacks.
The Dow has finished lower in September for 66 of the past 113 years, or about 58% of the time. The loss during the down years averages 4.67%, while the overall average decline for all 113 years is 1.16%.
There has been a recent disruption of the trend. The DJIA has put up a winning September in four of the past five years. But that doesn't appear to be in the cards for this September as the mood has grown decidedly negative.
September the cruellest month - National Post - 31st August 2010
Contrary to the opening line of T.S. Eliot's The Waste Land, September, not April, is the cruellest month -- for the stock market. Yes, October has a fearsome reputation built on great crashes and other pyrotechnics, but through the years September has on average delivered the worst returns.
Stock market enters September, traditionally its worst... - BusinessWeek - 31st August 2010
Could stocks be headed for another September swoon?
"If history is any guide, for it's never gospel, we may be in for another rough ride," says Sam Stovall, chief investment strategist at Standard & Poor's.
The result: September is usually a dog of a month for the market. It typically starts with solid market increases, then tails off, says Jeffrey Hirsch, editor-in-chief of the Stock Trader's Almanac.
"There's just a general selling bias in the month of September," he says.....
The bearishness continued well into September such as -
The stock market optimists are about to be crushed - MoneyWeek - 10th Sept 2010
with vast bullishness already baked into US stock prices, any knocks to confidence could send shares diving any day now...
It would be interesting to perform an analysis so as to see how far stocks would have to fall for the perpetual bear market resumption commentators to actually break even, probably all the way back to where the Dow was in March 2009. Instead of realising that they have been dead wrong for the past 18 months, the broken record just keeps playing as September turns into October.....
Stocks Stealth Bull Market Trend
The Dow during September continued the trend in line with my last quick analysis of (29 Aug 2010 - UK Economy Booms Whilst U.S. Stutters, Stocks Fail to Follow Crash Script ) that concluded in an anticipated break of the downtrend channel that the Dow had been in at the time, with the primary buy trigger at 10,200 to target the top of its trading range of 10,700 with probability favouring a break higher. With further interim analysis during the month confirming this view (05 Sep 2010 - Inflation Mega-Trend Long-term Growth Spiral Continues to Drive Stock Market Trend )
Bottom Line - Nothing new to report short-term the Dow remains in a corrective trading range of approx 10,700 to 10,000. Everybody tells you that September is usually one of the the worst months for stocks. I say its in a range with probability favouring a break higher.
The Dow has remained in its corrective trading range that has continued to work off the preceding 13 months bull run, 5 months so far, with my last in depth analysis (16th May 2010 - Stocks Bull Market Hits Eurozone Debt Crisis Brick Wall, Forecast Into July 2010 ) concluding that the corrective sideways trend could extend all the way into early October, with the subsequent price action pretty much following the script. The more time the stock market spends within its corrective trading range the more powerful will be the eventual breakout, then those waiting for corrections to enter will be waiting all the way to Dow 12,000+!
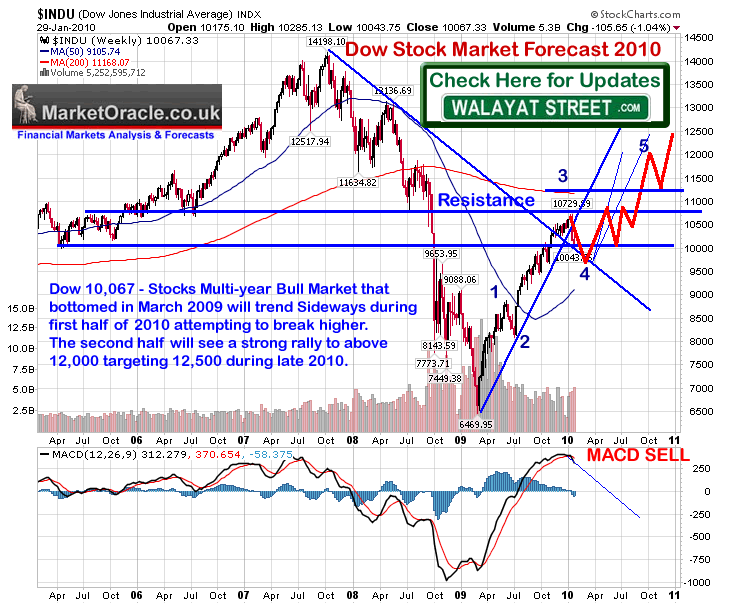
My next in depth analysis remains pending, however my original expectations remain for the Dow to target 12,000 to 12,500 by year end as illustrated by the below graph from the Inflation Mega-Trend Ebook (FREE DOWNLOAD). The longer term trend remains as I voiced right at the very bottom in March 2009 (15 Mar 2009 - Stealth Bull Market Follows Stocks Bear Market Bottom at Dow 6,470), is for the stock market to have entered into a multi-year bull market, so far the market has done NOTHING to negate this scenario.
An in-depth update and forecast for the Dow into the end of 2011 will follow current analysis due to be completed on GBP and UK interest rates. To receive these in your email in box ensure you are subscribed to my ALWAYS FREE Newsletter.
Comments and Source : http://www.marketoracle.co.uk/Article23127.html
By Nadeem Walayat
Copyright © 2005-10 Marketoracle.co.uk (Market Oracle Ltd). All rights reserved.
 Nadeem Walayat has over 20 years experience of trading derivatives, portfolio management and analysing the financial markets, including one of few who both anticipated and Beat the 1987 Crash. Nadeem's forward looking analysis specialises on UK inflation, economy, interest rates and the housing market and he is the author of the NEW Inflation Mega-Trend ebook that can be downloaded for Free. Nadeem is the Editor of The Market Oracle, a FREE Daily Financial Markets Analysis & Forecasting online publication. We present in-depth analysis from over 500 experienced analysts on a range of views of the probable direction of the financial markets. Thus enabling our readers to arrive at an informed opinion on future market direction. http://www.marketoracle.co.uk
Disclaimer: The above is a matter of opinion provided for general information purposes only and is not intended as investment advice. Information and analysis above are derived from sources and utilising methods believed to be reliable, but we cannot accept responsibility for any trading losses you may incur as a result of this analysis. Individuals should consult with their personal financial advisors before engaging in any trading activities.
Nadeem Walayat Archive |
© 2005-2022 http://www.MarketOracle.co.uk - The Market Oracle is a FREE Daily Financial Markets Analysis & Forecasting online publication.


