Where Are Crude Oil and Natural Gas Prices Heading Next?
Commodities / Crude Oil Oct 01, 2010 - 05:19 PM GMTBy: Marin_Katusa
Marin Katusa, Chief Energy Strategist, Casey Research writes: Oil is heading to US$200 per barrel. This isn’t speculation but hard fact. But forewarned is forearmed, and with this price expected within the next five years, investors have plenty of time to position themselves.
We recently have been talking about tools that investors can use to navigate the economic landscape. The gold-to-oil ratio is one such tool, but another popular compass is the oil-to-natural gas ratio.
The oil-to-natural gas ratio relates more to nuances within the energy complex, rather than the gold-to-oil ratio, which relates to monetary values. It’s the WTI Cushing price of crude oil per barrel to the Henry Hub Spot Price for natural gas per million thermal units.
In theory, based on an energy equivalent basis, crude oil and natural gas prices should have a 6-to-1 ratio. Market characteristics, however, have dictated that since 2006, the price of oil follow a pattern of 8-12 times that of natural gas.
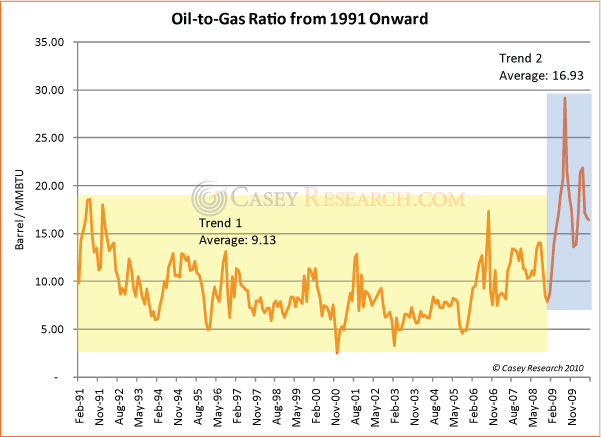
As the chart below shows, historically the oil-to-gas ratio from 1990 to 2008 was in the low 9s. This means one barrel of crude oil was equivalent to about 9,000 cubic units (Mcf) of natural gas.

Improved drilling techniques and access to immense shale gas fields across the country have seen a boom in domestic gas production. Nor can gas wells just be shut down willy-nilly. The complexities of a gas well mean that it takes anywhere between three to six months to shut down operations.
And while the number of rigs sprouting up each year is decreasing, natural gas production is on the rise, with many of the shale wells coming online with their sources fresh and untapped.
Thanks to this flood of shale gas, the oil-to-gas ratio has risen to almost 17 on average. That is, one barrel of oil is now worth 17 Mcf of natural gas (17,000 cubic feet of gas)!
When we defined the oil-to-gas ratio, we used the term “thermal units.” It is interesting, then, that based on thermal units, one barrel of oil produces as much energy as roughly 6 Mcf of natural gas. So from a financial perspective, the oil-to-gas ratio is very different than in terms of energy.
Some companies and analysts use this disparity to their advantage, using the 6 instead of the 17 value to come up with the “barrels of oil equivalent” conversion for the value of gas. That’s a fudge factor of 2.8!
It’s an accounting mechanism that’s been turned into a completely legal but very shady promotion mechanism, one we watch for carefully.
It’s worth knowing that things can change very rapidly in the natural gas market. We do believe, though, that the current trend will continue for years to come, with the oil-to-natural-gas ratio ranging between 15 and 20.
For long-term investors, the oil-to-gas ratio is indicative of a paradigm shift in the markets. It is yet another tool in our collection of crystal balls for the economy and, if read correctly, is a great way to add some valuable holdings to a portfolio.
(Fortunately, you don’t need a crystal ball to profit from energy. All you really need is a subscription to Casey’s Energy Report, which you can try for three months, risk-free, by clicking here now.)
© 2010 Copyright Casey Research - All Rights Reserved
Disclaimer: The above is a matter of opinion provided for general information purposes only and is not intended as investment advice. Information and analysis above are derived from sources and utilising methods believed to be reliable, but we cannot accept responsibility for any losses you may incur as a result of this analysis. Individuals should consult with their personal financial advisors.
© 2005-2022 http://www.MarketOracle.co.uk - The Market Oracle is a FREE Daily Financial Markets Analysis & Forecasting online publication.


