


ISM Manufacturing Survey Points to Slowing U.S. Economy in Q3
Economics / US Economy Oct 02, 2010 - 03:20 AM GMTBy: Asha_Bangalore

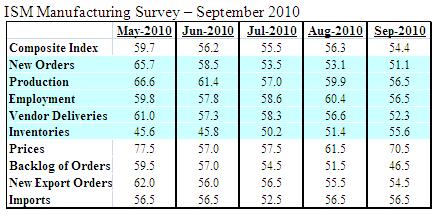
 The composite ISM manufacturing index edged down to 54.4 in September from 56.3 in the prior month. Indexes tracking production (56.5 vs. 59.9 in August), new orders (51.1 vs. 53.1 in August), employment (56.5 vs. 60.4 in August), and vendor deliveries (53.3 vs. 56.6 in August) declined, while the inventories index rose to 55.6 from 51.4 in August. Readings above 50.0 denote an expansion in activity. Although the levels of each of the sub-components of the composite index continue to hold above 50, the declines registered in September, excluding the gain in the inventories index, imply that factory activity advanced at a slower pace in September compared with August.
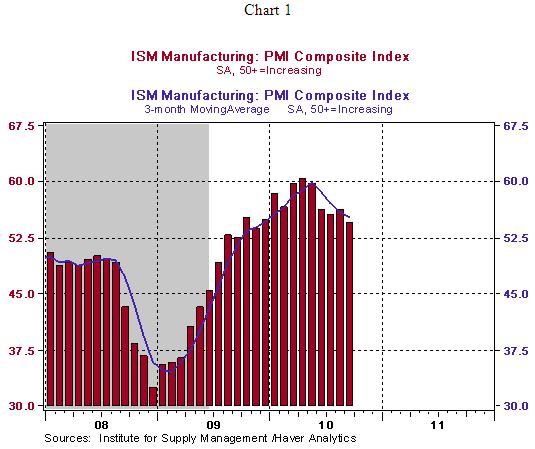
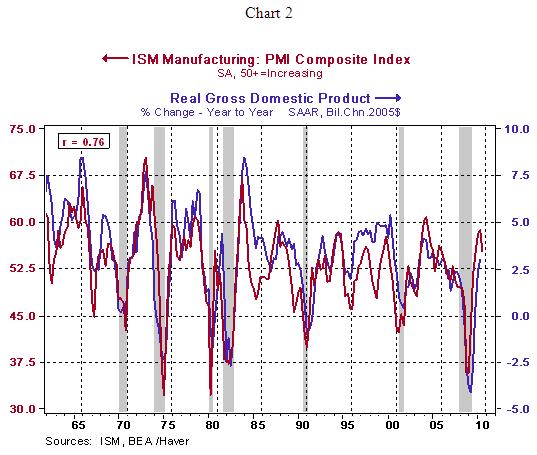
The ISM composite index has a strong positive correlation with the year-to-year change in real GDP (see chart 2). The third quarter average of the ISM index stands at 54.4 vs. 58.8 in the second quarter, which suggests a slowing of economic activity in the third quarter.
Consumer Spending on Track for Moderate Growth in Q3
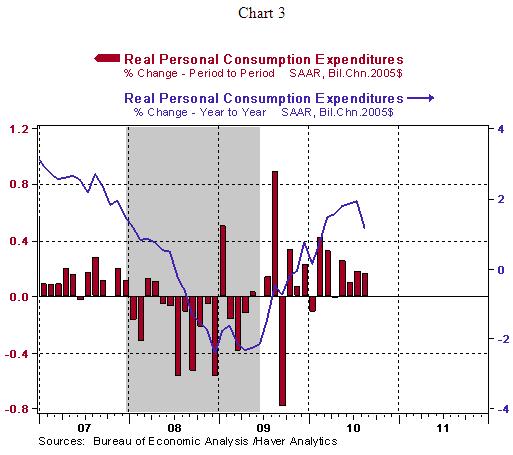
Nominal consumer spending increased 0.4% in August, matching the gain seen in July. After adjusting for inflation, consumer spending moved up 0.17% in August, nearly identical to the 0.18% increase in July. The July-August average of consumer spending and a conservative estimate for September results in a 1.9% annualized increase in consumer spending in the third quarter vs. a 2.2% gain in the second quarter. On a year-to-year basis, consumer spending rose 1.2% in August vs. 1.9% increase in July. As chart 1 indicates, consumer spending shows a decelerating trend.
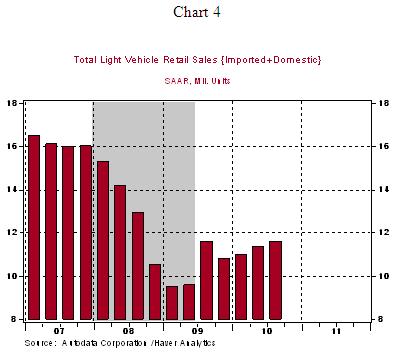
Auto sales rose to an annual rate of 11.76 million units in September, putting the third quarter average at 11.59 million units vs. 11.36 million units in the second quarter. The strength in auto sales implies a boost to overall consumer spending in Q3. Real consumer spending in September needs to exceed the 0.2% gain seen in August to match the 2.2% annualized gain in second quarter consumer outlays.
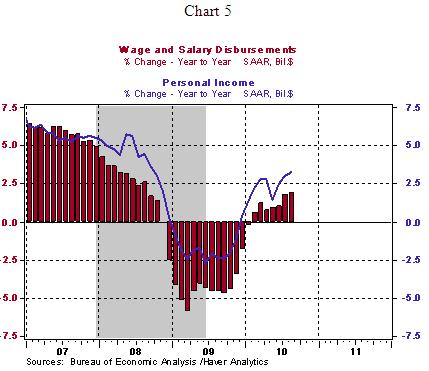
Personal income rose 0.5% in August after a 0.2% increase in the prior month. Wages and salaries moved up 0.3% in August vs. 0.4% in July. The headline personal income gain reflects a temporary lift from the renewal of unemployment insurance benefits (+$26.4 billion in August vs. -$15.6 billion in July). The underlying trend of wages and salaries is slightly more muted that overall personal income which has been raised by automatic stabilizers such as unemployment insurance (see chart 5).
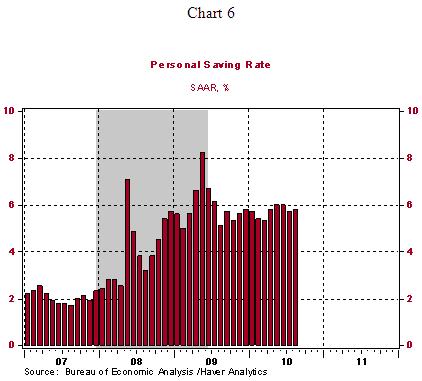
The saving rate of the United States moved up one notch to 5.8% in August. Year-to-date, the saving rate is 5.7% vs. 5.9% in 2009.
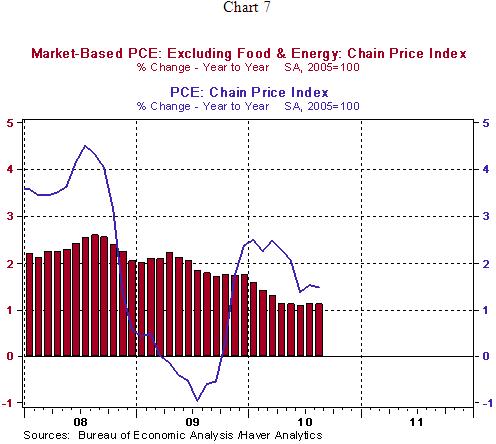
Inflation numbers continue to present a benign picture. The personal consumption expenditure price index rose 0.2% in August, matching the increase seen in July. On a year-to-year basis, this price gauge has risen 1.47%, down from a high of 2.49% in January 2010. The core personal consumption expenditure price index, which excludes food and energy, increased 0.12% in August vs. 0.08% in July. The year-to-year change in the core personal consumption expenditure price index has held between 1.09% and 1.12% for five straight months. The decelerating trend of both these price measures (see chart 7) and projected slowing of economic conditions in the second half of 2010 have raised the Fed's concern about a likely deflationary situation in the U.S economy.
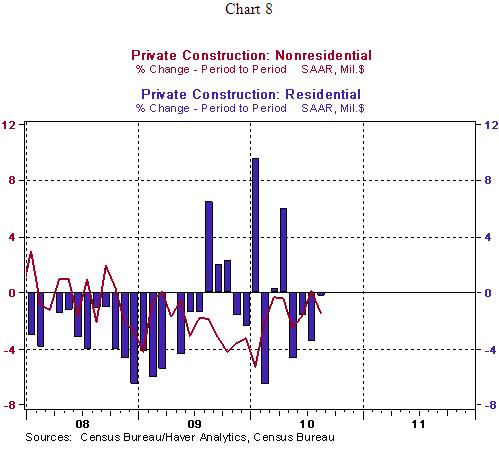
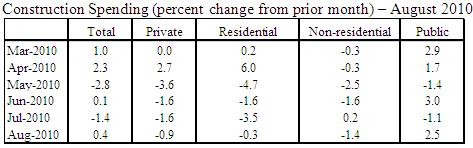
Construction Outlays Suggest Residential and Non-Residential Expenditures Likely to Make a Negative Contribution to Q3 GDP
Construction spending increased 0.4% in August, entirely due to a 2.5% increase in government outlays. But, residential (-0.3%) and non-residential (-1.4%) construction expenditures fell in August. The July-August average of both residential and non-residential construction expenditures point to a likely decline in the third quarter as reflected in the GDP report. The August construction report included large downward revisions to estimate of July private sector construction outlays, which accounts for a large part of the projected decline of these outlays in the third quarter.
Asha Bangalore — Senior Vice President and Economist
http://www.northerntrust.com
Asha Bangalore is Vice President and Economist at The Northern Trust Company, Chicago. Prior to joining the bank in 1994, she was Consultant to savings and loan institutions and commercial banks at Financial & Economic Strategies Corporation, Chicago.
The opinions expressed herein are those of the author and do not necessarily represent the views of The Northern Trust Company. The Northern Trust Company does not warrant the accuracy or completeness of information contained herein, such information is subject to change and is not intended to influence your investment decisions.
© 2005-2022 http://www.MarketOracle.co.uk - The Market Oracle is a FREE Daily Financial Markets Analysis & Forecasting online publication.