


Gold Short-term Looks Too Good
Commodities / Gold and Silver 2010 Oct 03, 2010 - 01:32 PM GMTBy: Merv_Burak

 Nine weeks of consistent upside action. It can’t continue for much longer before something gives. Gold is once more becoming the talk of the town (or the financial columnists). That by itself is a warning of impending collapse. What do I think? See below.
GOLD : LONG TERM
The long term can be dispensed very quickly. Gold continues to move well above its positive sloping moving average line. The long term momentum indicator continues to move higher inside its positive zone and above its positive sloping trigger line. The volume indicator continues to push higher into new high territory and above its positive sloping trigger line. Finally, the long term P&F chart remains in a bullish trend. What more is there to say? The long term rating at this time remains BULLISH.
INTERMEDIATE TERM
Looking at the short term chart (next section) we see an intermediate term up trending channel which covers the gold price action for the past nine weeks. A consistent up trend such as this cannot continue but which is the most likely direction for gold to take. It could accelerate from here and break above that upper resistance channel line or it could move sideways and lower towards the lower channel support line. Should the price action accelerate from here breaking through that resistance line this would then have all the effect of a blow-off stage where we get a sudden sharp up move and the bullish trend then ends for some time. I would, however, suspect that the most likely scenario is for gold to take a breather and move sideways or a little lower, towards the lower support line. We can then reassess its move once it gets there, should that be the case. Not shown on the short term chart but quite evident on an intermediate term chart (with intermediate term indicators) are the intermediate term momentum and volume indicators. Both are in up trends and are trapped, similar to the gold price trend, in very tight up trending channels. The momentum up trend goes back to the same point as the gold price does while the volume up trending channel goes back to the Mid-May low point. In all three cases the indicators and gold price are butting up against their upper resistance channel trend lines. Although there is nothing that says these indicators cannot break above their respective resistance lines I would be inclined to think that the most likely scenario is similar to that mentioned for gold, sideways or lower from here. Gold could go slowly higher from here remaining just below its up trend resistance line and that should keep the indicators just below their lines but that might be asking for too much.
Despite all the above, the present technical position of gold is still very positive. If there is going to be a turn we should see it reflected first in the short term indicators and then in the intermediate term ones. Right now the price of gold remains above its positive moving average line and the momentum indicator remains inside its positive zone above its positive trigger line. The volume indicator is still quite positive and remains above its positive sloping trigger line. The intermediate term rating for gold therefore remains BULLISH. The short term moving average line remains above the intermediate term line for confirmation of the bull.
SHORT TERM
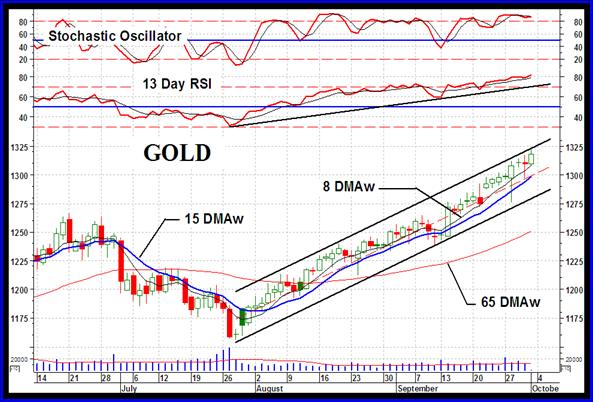
From the short term perspective everything still looks good but possibly too good. As the chart shows, everything seems to be going through the roof but maybe the roof is too strong and the result may be a tumble back to lower levels. An interesting pattern shown on the chart is the tightness of the daily gold action. Although it has been inside that up trending channel for 9 weeks most of that time it has been in the upper half of the channel line. In fact except for the very rare day here and there and a few days in mid-Sept it has spent all of its activities in that upper half. Such a tight up trending activity is quite seldom seen and results in an eventual drop to lower levels. A reversal of 50% of its upside move would not be surprising. Anything less of a reaction would confirm an on going long term strong bullish trend.
Going back to the short term we have the price of gold continuing above its positive sloping moving average line. The momentum indicator remains in its positive zone above its positive trigger line. In fact, the momentum indicator is in new high ground inside its overbought zone suggesting two things, a strong move in progress and a reversal of trend not too far ahead. When we do have a strong bullish move in the price it is not unusual for the momentum indicator to remain in its overbought zone for some time. In such cases a move below the overbought line, which is usually a signal that the reversal in price has started, may only be very temporary. We’ll have to see how things transpire from here. The daily volume action remains continuously low although it has perked up somewhat recently. All in all the short term rating remains BULLISH. The very short term moving average line remains above the short term line (where it’s been since late July) confirming the rating.
As for the immediate direction of least resistance, I’ll have to rely upon the flip of the coin again. Tails it is so I should go negative but I think I’ll go with the lateral direction. There are just too many positive indicators right now and that makes me cautious while a sudden reversal just doesn’t seem in the works.
SILVER
That bright shine you see is the refection of the sun off silver. Silver continues to out perform gold. It is at new recovery highs and new bull market highs since hitting its low just above the $4 mark in late 2001. Unlike gold, however, it is not yet at all time highs. That was at the $41.50 level back in Jan of 1980. Looks like silver is heading in that direction again. Yes, I know that the price mentioned does not reflect the effects of inflation but only the super sophisticated really keep track of the inflation adjusted figures.
There seems to be a sharp disconnect between the actions of silver and that of the “quality” silver producers. While silver is into new bull market highs the quality silver stocks, as represented by the Merv’s Qual-Silver Index, are still some 20% below their 2008 highs. The more speculative silver stocks (represented by the Merv’s Spec-Silver Index) are, however, some 40% above their 2008 highs and acting quite well. For now the speculative stocks are where the action is.
PRECIOUS METAL STOCKS
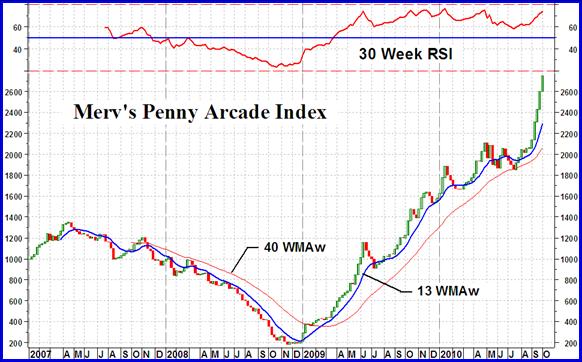
This seems to be one of the few places that provides the information of how the penny gold and silver stocks are really doing, without the hype and propaganda. Although I’ve been following the gold stocks for longer than I care to remember I’ve never thought of developing an Index to track their performances. I did so only a few years back so the Penny Arcade Index only goes back to the beginning of 2007. It does, however, show the end of a bull move, the bear market of 2008 (2007 and 2008 for the pennies) and the bull market since the end of 2008. I don’t know how the Index would have looked like since the start of the gold bull but if the Merv’s Gamb-Gold Index is any help it suggests that the pennies probably performed as well then as now.
With this minimal history I am assuming that the overall precious metal stocks will continue in their bull market (with periods of reaction) as long as the pennies are in their bull market. Once the pennies turn the overall universe of gold and silver stocks will still move higher for some time before they turn so the pennies would be an advance warning indicator. One way of realizing if the pennies have turned into a bear trend is if the Penny Arcade Index drops below its long term moving average line, the moving average line has turned down and the long term momentum indicator (the 30 week RSI) has dropped below its neutral line into its negative zone (below the 50% level). We are still far from that happening so an overall bull market in the universe of gold and silver stocks continues (with some periods of reaction as is normal in any bull market). A long term bull trend may be defined by the opposite to the above.
I have had a couple of questions about the Penny Arcade Index because it just looks too good to be true. The Index represents the average weekly performance of the 30 component penny stocks. Penny stocks are not stocks that you buy and hold for your old age. The pennies are stocks that you take a gamble on for sharp quick moves and get out when those moves are over. The component stocks in this Index are more often replaced than those of other Indices for this reason. Although there WILL come a time when almost all pennies will go into serious bear moves and the Index will likewise move seriously lower (such as in 2007-2008) I try to maintain component penny stocks that have a chance of out performing. When they start to significantly under perform or loss speculative interest by lack of daily trading activity, they are then targets for replacement. Over the past few weeks a third of the component stocks were replaced. Although The Penny Arcade Index is not intended to be a “managed” portfolio of stocks, such as a mutual fund, it is partially that. As history shows, you could do a lot worst than being in the pennies when they are in a bull market (as defined earlier) and getting out when they go into a bear market. DO NOT, under any circumstances, remain in the pennies when they turn bearish. Praying for a recovery at such a time could lead to financial disaster.
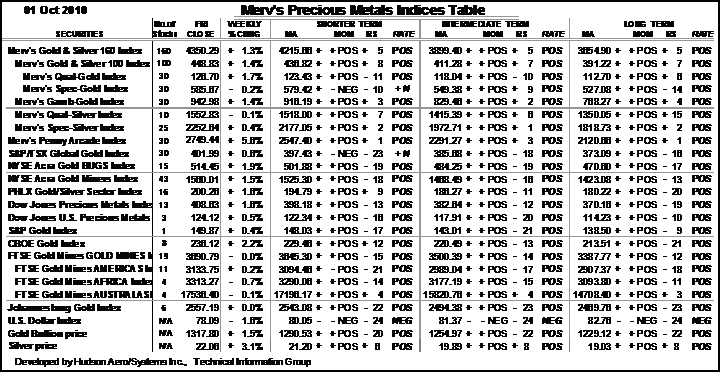
Merv’s Precious Metals Indices Table
Well, that’s it for this week.
By Merv Burak, CMT
Hudson Aero/Systems Inc.
Technical Information Group
for Merv's Precious Metals Central
For DAILY Uranium stock commentary and WEEKLY Uranium market update check out my new Technically Uranium with Merv blog at http://techuranium.blogspot.com .
During the day Merv practices his engineering profession as a Consulting Aerospace Engineer. Once the sun goes down and night descends upon the earth Merv dons his other hat as a Chartered Market Technician ( CMT ) and tries to decipher what's going on in the securities markets. As an underground surveyor in the gold mines of Canada 's Northwest Territories in his youth, Merv has a soft spot for the gold industry and has developed several Gold Indices reflecting different aspects of the industry. As a basically lazy individual Merv's driving focus is to KEEP IT SIMPLE .
To find out more about Merv's various Gold Indices and component stocks, please visit http://preciousmetalscentral.com . There you will find samples of the Indices and their component stocks plus other publications of interest to gold investors.
Before you invest, Always check your market timing with a Qualified Professional Market Technician
Merv Burak Archive |
© 2005-2022 http://www.MarketOracle.co.uk - The Market Oracle is a FREE Daily Financial Markets Analysis & Forecasting online publication.