


When Will the Gold and Silver Rally Stop?
Commodities / Gold and Silver 2010 Oct 10, 2010 - 11:50 AM GMTBy: Merv_Burak

 Is it the economy, is it world tensions, who cares, the precious metals just keep on going higher and higher. Where they will stop nobody knows. But they will stop sometimes. Tomorrow or next year, that’s the question?
GOLD : LONG TERM
During a bull market the long term changes very seldom. Looking at all the indicators the positive ones just continue to be positive. No use wasting much time trying to analyze something that doesn’t change. The gold price remains above its positive moving average line, the long term momentum indicator remains in its positive zone above a positive trigger line and the volume indicator continues to move higher above its positive trigger line. All is still right with gold and the long term rating remains BULLISH. The long term point and figure chart continues on its upward path and remains bullish also.
INTERMEDIATE TERM
The price of gold has been in a blazing up trend for over two months now. It had been trapped inside a well defined and narrow up trending channel but this past week moved above the channel upper resistance line. Whether this is a warning of future sharp up moves or just a very short term blip on the chart remains to be seen. It may be setting itself up for a new trend that is more aggressive than the past two months but as mentioned, that remains to be seen. The intermediate term momentum indicator had also been in a well defined upward tracking channel and this past week moved out of the channel, but only for a couple of days. It closed the week back inside the channel. The same for the volume indicator. It broke above its channel upper line but by the end of the week was back inside the channel, although right at the upper levels of the channel.
Despite whatever warnings these indicators may or may not be giving their message as to where the intermediate term position of gold is, is clear cut. The gold price remains well above its positive sloping moving average line. The intermediate term momentum indicator remains in its positive zone above its positive trigger line. The volume indicator remains in a positive trend above its positive sloping trigger line. All remains well and the intermediate term rating, at this time, remains very BULLISH. This is continuing to be confirmed by the short term moving average line continuing on its way comfortably above the intermediate term line.
SHORT TERM
The channel that gold price has been in, mentioned above, is shown on the short term chart. We see the sharp move on Tuesday which took gold above the channel upper trend line. The interesting point to note is the volume action. On that Tuesday the volume was not all that high. It was considerably higher on Wednesday when gold price really went nowhere. We had high volume on Thursday when gold took a tumble. Manipulation here?
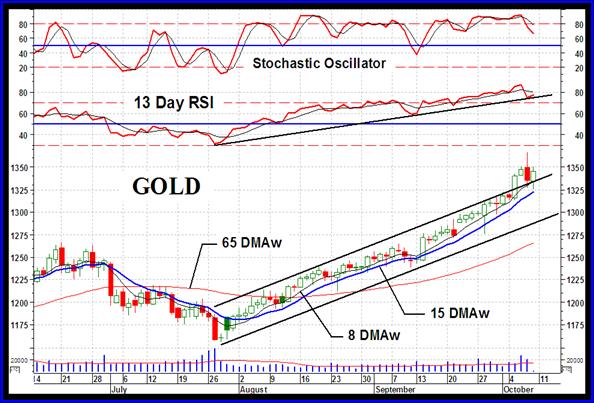
Of note on the chart is the short term momentum indicator. It has been in its overbought zone for a few weeks now. This past week it has dropped below its trigger line but not yet below its overbought line, nor the up trend line. For now we are still safe and in a roaring short term bull but that might change any day. The gold price remains above its short term positive sloping moving average line. The momentum indicator, as mentioned, is in its positive zone and in its overbought zone but has already dropped below its negative sloping trigger line. The daily volume action is somewhat mixed and not giving a clear message. High on a down day but also high on an up day. In any case the summation of the indicators continues to give me a BULLISH rating for the short term. The very short term moving average line continues to move above the short term line for confirmation of the bull.
As for the immediate direction of least resistance, with the Stochastic Oscillator continuing to move lower even as the price of gold moves higher one must be cautious that a turn around is not far away. I will go with the lateral direction as I’m not sure the turn is already here or if the rally has a few more days to go.
SILVER
The P&F chart continues to be positive with silver in a roaring bull market. The last projections it gave us was to the $24.00 level and then on to the $32.50 level. We are almost at the $24.00 level, close enough to say it met its projection although we still need another $0.47 from Thursday’s high. So, let’s start looking forward to the $32.50 projection.
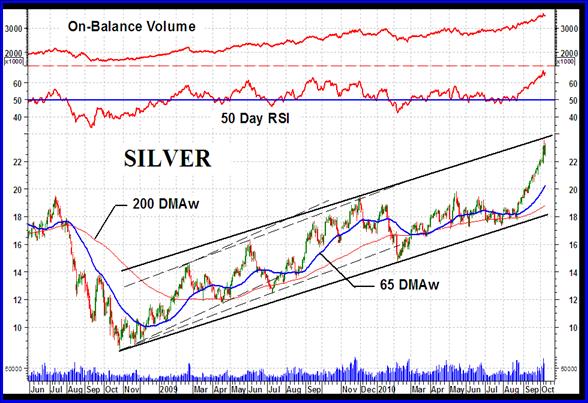
Technicians like to draw lines (trend, support/resistance, Fibonacci, Gann, etc.) on the chart, me included. One of our favorite lines are channel trend lines. Shown on the chart in dark black are the latest channel trend lines for silver. Now, technicians like to attach mysterious properties to these lines giving them the power to attract or dispel the daily price activity, that’s how the lines were drawn in the first place. But let’s get real here. These lines are nothing other than guide lines and have no predictive qualities either to attract or dispel the daily market action. The latest channel trend lines could not be drawn until well over a year after the bottom was reached and from where the support line starts. Yes, the subsequent action did bounce off the lower support line this past July/Aug and it is now almost at the upper resistance line. Will it react and drop from here BECAUSE of the resistance line? Or will it drop just from over exhaustion from the past several weeks of streaming upside action? Or will the action continue and break through the upper resistance line, after all we had two previous channel trend lines which were a total flop.
Early in this bull trend we could draw a channel using the April 2009 low as the support line. Darn, a few months later that support line was broken. We then drew a new support line and upper resistance line using the July low. Darn again, that line was broken in Feb of this year so now we have a third try at a support and resistance lines. Will this channel now hold? I doubt it. At some point it too will be broken. What this highlights is that although these support and resistance trend lines may come in handy from time to time one should not gamble any capital based upon these lines. I like drawing these lines but I’m also a realist in understanding their limitations.
Back to the silver metal. Silver has been a gung-ho metal for some time now and has consistently out performed gold lately. The trend is over exuberant and could be ready for a rest period or even a reaction from about here. The short term momentum indicator remains in its overbought zone but like gold has already dropped below its negative sloping trigger line. On a very short term basis the Stochastic Oscillator has now dropped below its overbought line for a warning that a reversal of trend may be at hand. Although all the indicators for the short, intermediate and long term are positive with BULLISH ratings for all three time periods one should be very careful going forward as far as acting on the up side is concerned.
As far as stocks are concerned, as mentioned often lately, the place to be is in the speculative silver stocks rather than the quality issues. I always prefer the intermediate term when looking at the precious metal stocks. In my universe of 160 gold and silver stocks the top three speculative silver stocks from my Merv’s Spec-Silver Index are rated as number 6, 11 and 12 out of 160 stocks while the top three quality stocks from my Merv’s Qual-Silver Index are rated as number 66, 73 and 76 out of 160 stocks. The largest quality silver stocks are even worse than that with Agnico-Eagle in 95th place out of 160 while Pan American Silver is in 112th place.
PRECIOUS METAL STOCKS

I’ve mentioned my Merv’s Spec-Silver Index often here so it’s about time I showed what the Index looks like. The Index here represents the full time period from its original development in Jan of 2003 to this past Friday. There are a couple of things one can take from this Index. First, when it moves it REALLY moves, up or down. The second, after its up move it has a habit of taking a breather for years.
Since its bottom late 2008 this Index of 25 speculative silver stocks is up over 500%. Of course some, if not most, of these stocks are not pure silver stocks but all 25 have major silver interests.
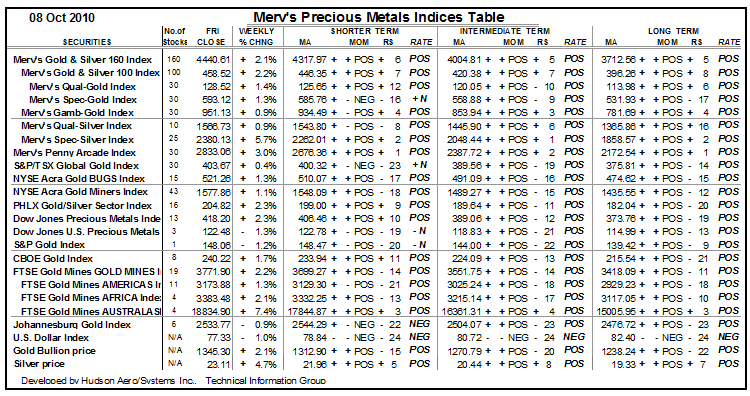
The week was another good week for the precious metal stocks. Most of the Indices were up in the 1% to 2% range while the Merv’s Spec-Silver Index was ahead by 5.7%. The pure gambling index, Merv’s Penny Arcade Index, was ahead by 3.0% and still in a very good up trend. No warnings yet of a major top. For the intermediate term I keep track of how many of the 160 universe stocks have last given a BULL signal and how many a BEAR signal. The ratio on Friday stands at 89% gave a bullish signal while only 11% gave a bear signal. There is very little more upside room to get more bullish while there is now a great deal of room for the market to turn more bearish. That may not yet be happening but it will sometime ahead.
Merv’s Precious Metals Indices Table
Well, that’s it for this week. Comments are always welcome and should be addressed to mervburak@gmail.com.
By Merv Burak, CMT
Hudson Aero/Systems Inc.
Technical Information Group
for Merv's Precious Metals Central
For DAILY Uranium stock commentary and WEEKLY Uranium market update check out my new Technically Uranium with Merv blog at http://techuranium.blogspot.com .
During the day Merv practices his engineering profession as a Consulting Aerospace Engineer. Once the sun goes down and night descends upon the earth Merv dons his other hat as a Chartered Market Technician ( CMT ) and tries to decipher what's going on in the securities markets. As an underground surveyor in the gold mines of Canada 's Northwest Territories in his youth, Merv has a soft spot for the gold industry and has developed several Gold Indices reflecting different aspects of the industry. As a basically lazy individual Merv's driving focus is to KEEP IT SIMPLE .
To find out more about Merv's various Gold Indices and component stocks, please visit http://preciousmetalscentral.com . There you will find samples of the Indices and their component stocks plus other publications of interest to gold investors.
Before you invest, Always check your market timing with a Qualified Professional Market Technician
Merv Burak Archive |
© 2005-2022 http://www.MarketOracle.co.uk - The Market Oracle is a FREE Daily Financial Markets Analysis & Forecasting online publication.