Stocks Stealth Bull Market Closes Back Above Dow 11,000
Stock-Markets / Stocks Bull Market Oct 10, 2010 - 12:52 PM GMTBy: Nadeem_Walayat
 Today's a great day for numerologists - 10th day of the 10th Month of the 10th Year. What happened on past such days ? Apparently nothing!
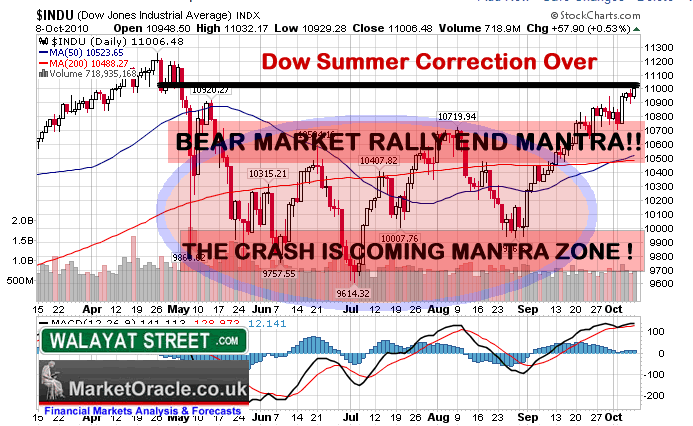
The Dow on Friday closed above 11,000 at 11,006 for the first time since just before the May 6th Flash Crash. Off course no one saw the flash crash coming, but subsequently many of a perma mindset have eagerly anticipated its re-occurrence all the way back to above Dow 11k.
The whole summer has seen the perma-bears and the BlogosFear busy chasing their tails by confusing what amounts to propaganda with analysis as they take a pre-existing WRONG conclusion and then go in search for data that supports it, much as the perma deflationists have picked at the odd bits of deflation indications to back up a model that does not exist in reality (26 Aug 2010 - Deflation Delusion Continues as Economies Trend Towards High Inflation).

During the summer months the expectations of another always imminent flash crash morphed into June and July's bearish Head and Shoulders price pattern, that saw its right shoulder twist and turn as another higher shoulder always materialised hunchback of Notre Dam style all the way into August which turned into the dreaded always imminent Hindenberg Omen Crash month, to be soon replaced during September by repetitive warnings that that September could be the worst month of the year on the basis of statistics and perma views when it turned out to be the BEST September for 70 years !
Mapping Out the Trend for 2010
The Dow during September continued the trend in line with my last quick analysis of (29 Aug 2010 - UK Economy Booms Whilst U.S. Stutters, Stocks Fail to Follow Crash Script ) that concluded in an anticipated break of the downtrend channel that the Dow had been in at the time, with the primary buy trigger at 10,200 to target the top of its trading range of 10,700 with probability favouring a break higher. With further interim analysis during September confirming this view (05 Sep 2010 - Inflation Mega-Trend Long-term Growth Spiral Continues to Drive Stock Market Trend )
Bottom Line - Nothing new to report short-term the Dow remains in a corrective trading range of approx 10,700 to 10,000. Everybody tells you that September is usually one of the the worst months for stocks. I say its in a range with probability favouring a break higher.
The Dow had remained in its corrective trading range that has continued to work off the preceding 13 months bull run, with my last in depth analysis (16th May 2010 - Stocks Bull Market Hits Eurozone Debt Crisis Brick Wall, Forecast Into July 2010 ) concluding that the corrective sideways trend could extend all the way into early October, with trading range expectations for a low at 9,800 to be followed by the Dow targeting a break of 10,7000 with the subsequent price action pretty much having followed this script throughout the summer months. The more time the stock market spent within its corrective trading range the more powerful would be the eventual breakout.
My original expectations remain for the Dow to target 12,000 to 12,500 by year end as illustrated in the January Inflation Mega-Trend Ebook (FREE DOWNLOAD).
Stocks Stealth Bull Market Summer Correction is Over
We are now well into October, and the perma bear delusion's continue as to why an end to the so called bear market rally is ALWAYS IMMINENT, despite that fact that the perma mindset has been WRONG SINCE MARCH 2009, who now explain the most recent rally action (after the event) as a consequence of imminent QE2 as the mechanism to blame for basically remaining clueless, the reasons for which I touched upon in a recent article (10 Sep 2010 - The Real Reason Why 90% of Traders Lose).
The bottom line remains as I voiced right at the bottom of the stocks bear market and the birth of the stocks stealth bull market in March 2009 - (15 Mar 2009 - Stealth Bull Market Follows Stocks Bear Market Bottom at Dow 6,470). That the stealth stocks bull market will be driven by the twin forces of either economic trends surprising to the upside or Quantitative Easing aka money printing to drive asset prices higher as once Q.E. STARTS IT CANNOT BE STOPPED whilst large budget deficits persist that require debt monetization regardless of what the central bankers publically state, something that I have iterated virtually every month for the past 2 years, including at length in the January 2010 Inflation Mega-Trend Ebook, because the whole banking system has been geared towards ONE OBJECTIVE and that is towards the monetization of government debt either via outright money printing or the fractional reserve banking system that entices the banks with huge profits to buy government bonds as I covered at length in the recent article (19 Sep 2010 - UK Government Stealth Debt Default Continues at Minimum Rate of 3% per Year).
Now, more than 18 months on, the perma-mindset (focused on propaganda rather than analysis), STILL do not get it, Despite the benefit of 18 months of HINDSIGHT!
Stocks are in a MULTI-YEAR BULL MARKET that is being driven higher either by corporate earnings surprises to the upside OR MONEY PRINTING in the face of weak main street economic activity. It does not matter which as prevalent at a particular point in time as the markets SPIRAL HIGHER in reaction to both waves of INFLATIONARY buying pressure, something that the dark pools of capital (which I try to emulate) recognised right at the birth of the stocks stealth bull market and have since been eager to bid the stock market higher whilst MOST have FAILED to participate in the rally to date (if not been engaged in betting against) and will continue to do so all the way to new bull market highs which is why it remains STOCKS STEALTH BULL MARKET as 99% of that which is written in the mainstream press and BlogosFear represents the regurgitation of the utterances from perma media whores who are in constant state of transit between TV studio make up rooms.
The same INFLATIONARY forces are driving up all assets such as commodities, whilst at the same time holding up other assets such as housing that should be in free fall as the bubble baton is passed from one asset class to another.
To regular readers I may be starting to sound like a broken record but in our fiat currency, big government deficit spending, debt accumulating world, governments CANNOT ALLOW FOR DEFLATION, not only that but inflation can literally always be created at the press of a button, therefore as asset prices are leveraged to consumer prices that is where wealth protection strategies should be focused towards. The only place you will lose is where the clueless deflationists tell you to be and that is in CASH AND BONDS (long dated).
Where will the stock market go next ?
The summer correction that saw the Dow base at between 10,000 and 9,800 is over, which means that the Dow trend targets 12,000 to 12,500 by year end, which whilst it won't get there in a straight line, the stock market has done nothing to negate this scenario for the whole of 2010. My focus during the coming week will be on an in depth analysis and chart trend forecast for the Dow to more precisely cover the trend into the end of 2010 which follows my current in-depth analysis under way on the USD that should be completed within the next 24 hours (UK interest rate forecast on hold).
To get the analysis in your email in box, then ensure you are subscribed to my ALWAYS FREE NEWSLETTER.
Comments and Source : http://www.marketoracle.co.uk/Article23393.html
By Nadeem Walayat
Copyright © 2005-10 Marketoracle.co.uk (Market Oracle Ltd). All rights reserved.
 Nadeem Walayat has over 24 years experience of trading derivatives, portfolio management and analysing the financial markets, including one of few who both anticipated and Beat the 1987 Crash. Nadeem's forward looking analysis specialises on UK inflation, economy, interest rates and the housing market and he is the author of the NEW Inflation Mega-Trend ebook that can be downloaded for Free. Nadeem is the Editor of The Market Oracle, a FREE Daily Financial Markets Analysis & Forecasting online publication. We present in-depth analysis from over 600 experienced analysts on a range of views of the probable direction of the financial markets. Thus enabling our readers to arrive at an informed opinion on future market direction. http://www.marketoracle.co.uk
Disclaimer: The above is a matter of opinion provided for general information purposes only and is not intended as investment advice. Information and analysis above are derived from sources and utilising methods believed to be reliable, but we cannot accept responsibility for any trading losses you may incur as a result of this analysis. Individuals should consult with their personal financial advisors before engaging in any trading activities.
Nadeem Walayat Archive |
© 2005-2022 http://www.MarketOracle.co.uk - The Market Oracle is a FREE Daily Financial Markets Analysis & Forecasting online publication.


