Commodity Markets Strategic Review - Gold, Silver, Crude Oil and Copper
Commodities / Forecasts & Technical Analysis Jan 19, 2007 - 07:32 PM GMTBy: Clive_Maund
As an investor, what matters to you more than anything, what is of paramount importance, is determining whether what you have invested in, or are thinking of investing in, is going to go up, down or sideways. If you are long you want the market to go up, if you are short you want it to go down, and if you have written both Call and Put options, you want it to move sideways. All consideration of fundamentals is subordinate to this Prime Objective.
Gold, Silver and Precious Metals stocks have been trading sideways for about 9 months now, following their strong advance to the April - May peak of last year, with many smaller stocks having slithered down a "slope of hope" to plumb low levels in the recent past. Understandably, many investors in the sector are growing increasingly fed up and frustrated with this situation, especially as every time the sector looks set to break higher it has suffered a smackdown. The purpose of this essay is to assess the current situation and to discuss effective tactics for dealing with it.
We are going to look at a broad range of charts in this article, because the Precious Metals sector does not exist in a vacuum - its fortunes are linked to the performance of other commodities, such as base metals and oil, and to trends in financial instruments such as T-bills and T-bonds, and of course to the mighty US dollar.
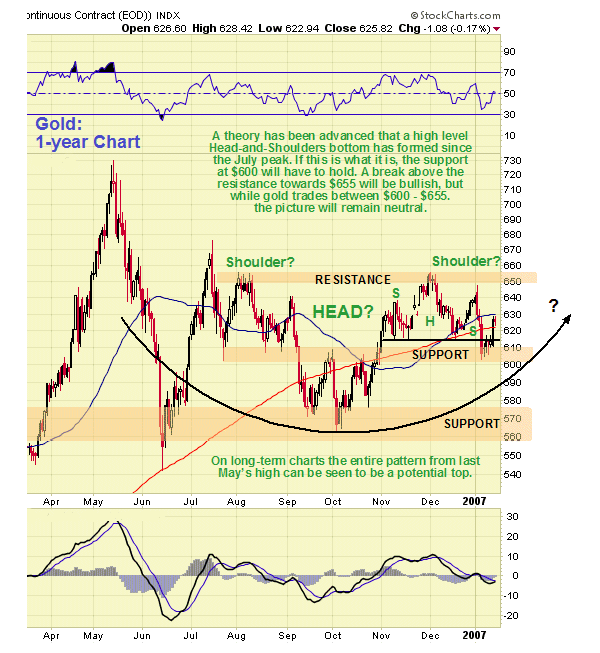
We will start by looking at the 1-year chart for Gold, which enables us to examine the entire sideways pattern from the peak last May in detail, and to put recent action into context. On this chart we can see how early this year gold broke down from a small Head-and-Shoulders top that started to develop from early November, an event that was predicted on www.clivemaund.com as the price went into the Right Shoulder of the pattern, only to abort the pattern last Friday by breaking back strongly above the neckline, which we sidestepped by closing out short positions on Thursday. Due to this action gold finds itself once more rangebound between support at and above $600 and resistance at $650 - $655. So how does this recent action fit within the larger picture going back many months?
Some other writers have advanced the notion that what is known as a "High Level Head-and-Shoulders Bottom" may have formed between the middle of last July and the present, and this has been tentatively marked on the chart. This pattern is so called because, unlike a normal Head-and-Shoulders bottom, it is not preceded by a drop of any significance. This theory is credible because the drop this month stopped EXACTLY at the low of last July so that the low of the Left Shoulder is at exactly the same level as the low of the Right Shoulder. The Head-and-Shoulders is a variant of a rounding turn and is thus related to formations such as Cups and Saucers. The curved line on our chart shows the gradual change of trend from down to up, and reveals that this Head-and-Shoulders can be said to have followed the decline from the peak last May, despite the intervening crevasse, although this does not mean that it cannot break down from here.
BullionVault.com is currently giving a FREE gram of Swiss vaulted gold bullion to everyone who registers (worth $24)- to try the service and learn how to trade. Sign-up is easy, fast and credits you immediately
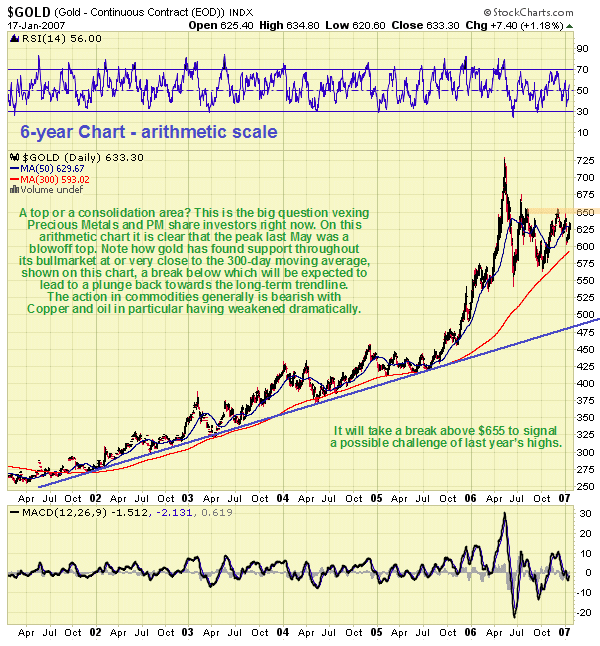
Having considered recent action on the 1-year chart, we will now look at a 6-year chart that shows the bullmarket in gold from its inception, and as we will see this chart provides a completely different perspective from the 1-year chart. An arithmetic scale has been selected for this chart for two reasons; one is that we get a better trendline fit - the 2004 low touches the trendline on the arithmetic chart, but doesn't on the log chart, and the second reason is that the arithmetic chart makes it clearer that the high of last May was a "blow off" top that called for a lengthy period of consolidation at the least, which we have had, and may mean we are in for a deeper reaction back towards the trendline, which would make the entire period from the May high through to the present one long top area.
Note that on this long-term gold chart we have switched from our customary 200-day moving average to a 300-day, for as we can see, this provides a better fit. The price has rallied from the vicinity of the 300-day moving average throughout the bull market, and therefore the current position of gold just above this average does put it in position to break higher, going on the basis of this factor alone.
So, on the one hand, we have gold completing what looks like a High Level Head-and-Shoulders Bottom, with the price in a favorable position relative to its 300-day moving average, from which it has rallied throughout its bull market, and on the other hand it is still way above its long-term uptrend line on the long-term chart, and this is the case whether you use an arithmetic or log scaling, so that the pattern that has formed since the blowoff top last May could be a large top area projecting the price back to the trendline, which would involve a huge drop back to the $480 - $500 area. In attempting to arrive at a conclusion about which way it is likely to break, there is fortunately additional evidence available first from the Silver chart and then from the commodity sector as a whole that can help throw light on the situation.
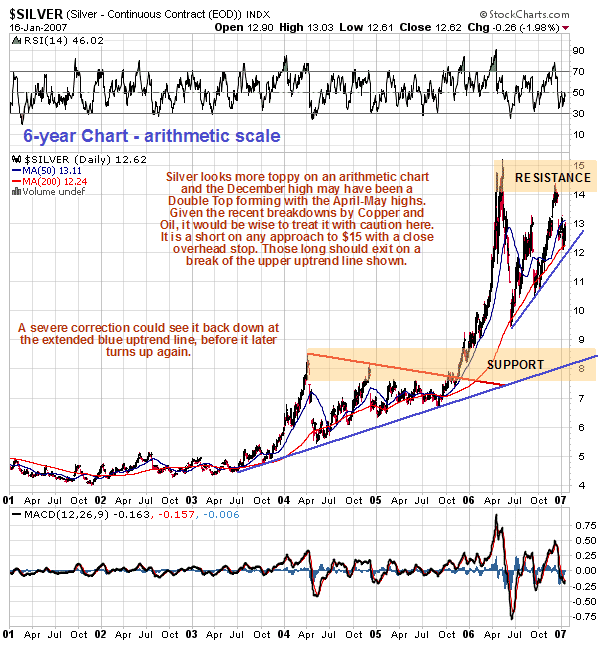
Starting with silver, we will look at a long-term arithmetic 6-year chart, to enable direct comparison with gold. As we can see, Silver looks toppy on this chart, but is in with a chance as long as it can hold above the upper blue trendline drawn on the chart. It is of course a short with a close overhead stop on any approach to the highs of last May just above $15, where there is strong resistance, and any open long positions should be exited in the event that the upper blue trendline, currently approaching $12, fails. If that happens, a plunge back towards the lower support zone is to be expected. It has to be said that the picture in silver does not auger well for gold. We will be having a look at the chart for Silver Wheaton (SLW) on www.clivemaund.com which was recommended on the site early in 2005 at $3.50 and has risen almost 100-fold in just over 3-years, to see what it portends for silver itself.
Gold and silver are not, of course, as mentioned above, insulated from what is going on in the rest of the financial markets. The major trends in base metals and oil in particular are loosely related to the major trends in Precious Metals.
Some readers may recall that the writer was recently the subject of a thinly veiled personal attack in an article posted on public websites. This attacker boldly proclaimed that readers should do what the pros do and buy when something drops back to its rising 200-day moving average, as if he had discovered the Holy Grail. Let's just see where this would have got you with Copper by looking at its 6-year chart.
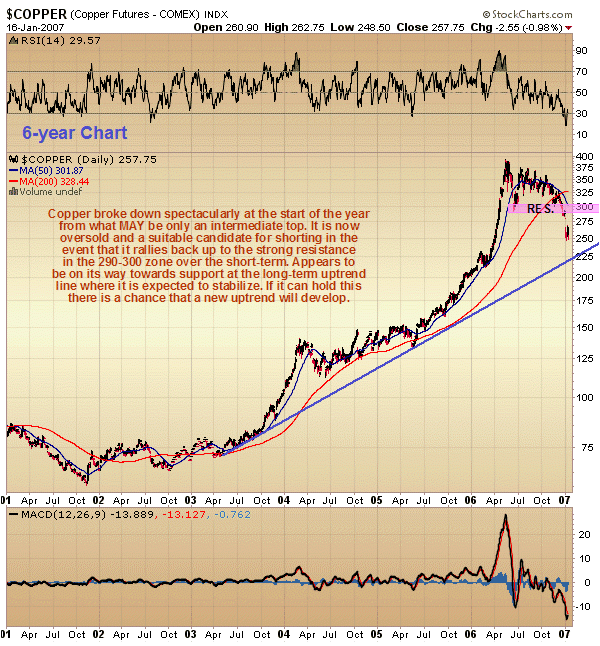
That's right, precisely nowhere. The irony is that we did "do as the pros do" by buying Copper on its first contact with its 200-day moving average, when it was just above 300, but quickly exited when our stop at 290 was triggered just before the collapse. A calculated risk and that time it didn't work and we escaped with a small loss.
The chief reason for looking at Cooper is to weigh up how its movements may influence Precious Metals prices going forward. Certainly it does not look like Gold and Silver are going to get much support from Copper in the near future, for Copper looks like it is on its way to test support at its long-term trendline. If it can hold that and stabilize and then turn up again, it will then perhaps be a supporting influence for the Precious Metals. Over the short-term, however, if it should rally back into the resistance in the 290 - 300 zone it will be regarded as a candidate for shorting.
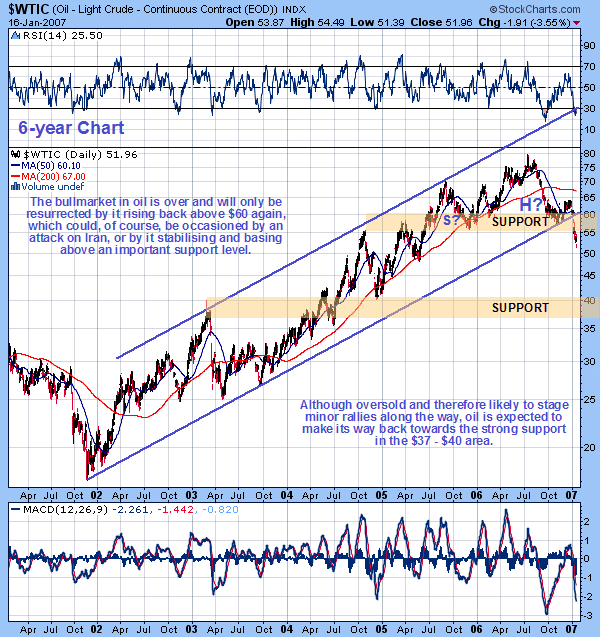
The rapidly deteriorating pattern in oil was highlighted in the Oil Market update of 2nd January on www.clivemaund.com and immediately afterwards the long-term uptrend in oil that had been in force for 5 years failed, and this was followed by failure of important support at and above $54. Oil must now be classified as a bear market at least it until it can stabilize above important support and form a base for renewed advance. In the absence of some dramatic development such as an attack on Iran, it will likely head back towards strong support in the $40 area. In the short-term it is oversold and likely to rally, which would be viewed as an opportunity to short it.
One fundamental analyst whose opinion I normally respect opined that the drop in the price of base metals such as Copper and in the price of oil would be beneficial to the prices of Precious Metals stocks, because these materials are a key cost factor in the construction of mines. When I had recovered sufficiently from laughing I pointed out that if this were the case then why were Precious Metals stocks and base metals and oil all rising in tandem over the past 5 years and during the great commodities bull market of the 70's? As an example of clutching at straws this takes some beating.
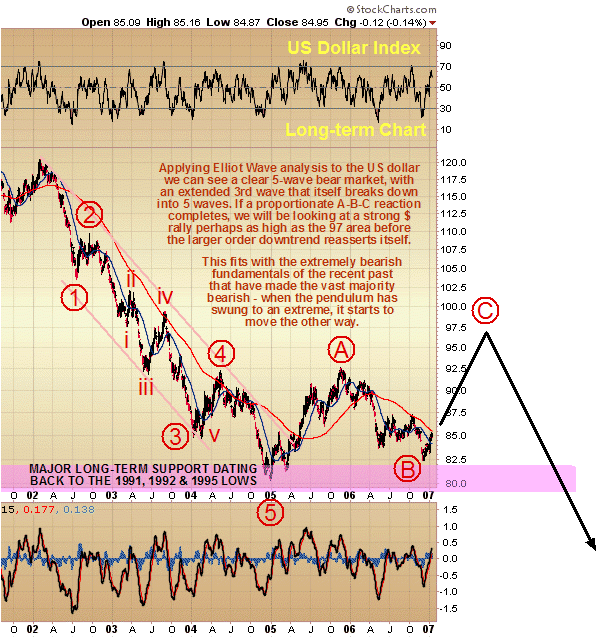
We will end with another look at the long-term dollar chart showing the wave count and projected target for a countertrend rally that we looked at a week or two ago. In the event that T-bonds rally to the 49.50 - 49.80 area, and then back off to form a Right Shoulder, probably involving a retreat to the 47 - 47.50 area, then the dollar can be expected to back off towards the 82 area, perhaps lower, which would likely be the occasion for a "sucker rally" in commodities generally, and Precious Metals in particular.
In conclusion, gold and silver will retain the potential to break out upside to begin new uptrends whilst the support for gold at $600 remains unbroken and silver remains above the upsloping trendline in force from its June low, and the breakouts will be signaled by gold rising above $660 and silver above $15.20. As many readers will no doubt be aware, there have been a lot of false breakouts over the past year thought to be due to market manipulators deliberately targeting chart followers. This means that a greater margin of error must be allowed to avoid being the victim of engineered whipsaw moves such as we saw in September when the HUI index staged a false breakout at the opening of the Las Vegas Gold Conference, before going on to plunge, and again with the false upside breakout at the very start of this year that was followed by a dramatic reversal.
On the downside, failure of gold's support at $600 and Silver's up sloping trendline will open up the risk of a plunge back to their respective long-term uptrend support lines, which could be dramatic. As things stand, this is considered the more likely scenario, due to the deterioration in commodities as a whole, and the strengthening of the US dollar, which is thought likely to confound its many bears by rising off of its long-term key support level. Those wishing to take advantage of such a plunge are referred back to the subscriber only article that appeared on 6th January on www.clivemaund.com -- Profiting from the Collapse - 10 stocks to sell short .
Before closing, I wish to make one thing absolutely clear to readers. As the proprietor of a website specializing in trading the Oil and Precious Metals sectors, it should be obvious that I derive no benefit from a bear market in these commodities, it is much better for my business when they are rising. However, I do not believe this consideration should color my thinking or prognostications on these markets, and I strive to remain objective - if I think they are going down I say so. Over the past several weeks I have come under attack from some Gold and Silver "cheerleaders" for "failing to keep my end up".
What these people don't realize is that you can't talk these markets up - they are going to do what they are going to do, regardless of who likes it or doesn't. You might be able to stir something up for a short while by hyping it, but it always ends up returning to where it would have been without the hype. I therefore intend to continue working to serve my readers' best interests by telling it like I see it.
By Clive Maund
CliveMaund.com
The above represents the opinion and analysis of Mr. Maund, based on data available to him, at the time of writing. Mr. Maunds opinions are his own, and are not a recommendation or an offer to buy or sell securities. No responsibility can be accepted for losses that may result as a consequence of trading on the basis of this analysis. Mr. Maund is an independent analyst who receives no compensation of any kind from any groups, individuals or corporations mentioned in his reports. As trading and investing in any financial markets may involve serious risk of loss, Mr. Maund recommends that you consult with a qualified investment advisor, one licensed by appropriate regulatory agencies in your legal jurisdiction and do your own due diligence and research when making any kind of a transaction with financial ramifications.
© 2005-2022 http://www.MarketOracle.co.uk - The Market Oracle is a FREE Daily Financial Markets Analysis & Forecasting online publication.


