


Stocks Bull Market Rolls Along, Long-term Elliott Wave Analysis
Stock-Markets / Stocks Bull Market Oct 16, 2010 - 05:10 AM GMTBy: Tony_Caldaro

 After a quiet beginning the market again moved to new uptrend highs this week. Economic reports were mostly positive with only four indicators worsening or weak, and thirteen steady or improving. On the negative side; weekly jobless claims increased as did the trade deficit, consumer sentiment and the monetary base declined. On the plus side; weekly mortgage applications increased along with retail sales, the NY FED, the WLEI and the M1 multiplier. Holding steady or improving; export/import prices, the CPI/PPI and business inventories. The budget deficit was also less negative. For the week the SPX/DOW were +0.75%, and the NDX/NAZ were +3.15%. Asian markets gained 2.2%, European markets were +1.7%, and the Commodity equity group was +1.0%. Bonds were -0.9%, Crude lost 1.5%, Gold gained 1.6%, and the USD lost 0.2%. Housing, industrial production and the FED’s beige book highlight the upcoming week.
LONG TERM: bull market
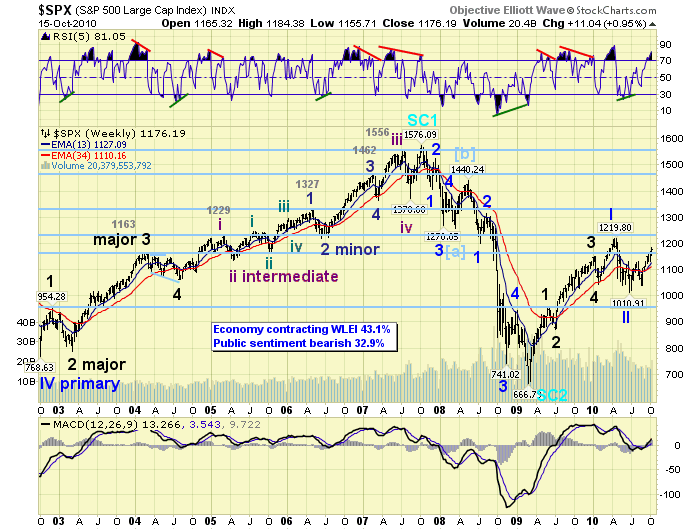
This week we review a chart we examined several months ago, while the market was in the Apr10 to July10 correction. We posted the chart below. You can also go to the link below under CHARTS and it’s the third chart down on the first page. This chart displays the weekly activity of the SPX from Oct02 to present. Before we discuss the wave structure there are several technical observations that should be noted.
First, at the bottom of the chart we display the weekly MACD. Notice during the Oct02-Oct07 bull market this indicator stayed above the neutral, the ”0″ line, for the entire bull market. Then when the market started to breakdown in early 2008 and enter a bear market, the neutral level was breached and this indicator stayed negative for all of that decline. Now observe in mid-2009 the MACD crossed above the neutral again and has remained above it ever since. This is normal bull/bear market action for this indicator.
Second, we like to review the RSI 5 indicator at the top of the chart. Notice during the Oct02-Oct07 bull market this indicator constantly hit an overbought reading – above 70. Then during the Oct07-Mar09 bear market it never hit an overbought reading. Now after the Mar09 low the RSI 5 is again hitting overbought readings. This also is normal bull market activity.
Third, we review the wave structure of the Oct02-Oct07 bull market, the Oct07-Mar09 bear market, and the current bull market. During the first bull market there was a five Major wave advance from the Oct02 low to complete Primary wave V. Also observe that Major waves 1 and 3 were relatively simple waves and Major wave 5 was quite detailed and extended. During the Oct07-Mar09 bear market the selloff was quite swift and the wave structure was a 5-3-5 zigzag.
Now during this bull market, anticipated to unfold between Mar09 and Feb12, we’re counting it as a five Primary wave structure. Primary wave I subdivided into five Major waves as noted on the chart. This was followed by a Primary wave II correction. Now the market should be in Major wave 1 of Primary wave III. Near the end of September we created a roadmap for the anticipated wave structure for this bull market. This is just a guideline but worth a look: http://caldaro.wordpress.com/2010/09/26/spx-bull-market-projection/. Clearly, from an objective elliott wave view, we see no reason to be bearish on the US equity market.
MEDIUM TERM: uptrend
This uptrend, Major wave 1, that started in early July has been somewhat different from the three previous Major wave uptrends of this bull market. The early part of the uptrend coincided with two separate cycle lows. First the four year Presidential cycle bottom in early July, and then the two year Tech product cycle bottom in late August. Since then this uptrend has made steady progress higher. In fact, four of the nine SPX sectors have already made new bull market highs: XLB (basic materials), XLK (technology), XLP (consumer staples) and XLU (utilites). In addition, the NDX and the NYAD (market breadth) posted new bull market highs this week as well. In the foreign markets five of the thirteen indices we track also made new bull market highs: BSE (India), BVSP (Brazil), DAX (Germany), HSI (Hong Kong) and the TSE (Canada). Plus the Dow Jones World index also made a new bull market high. These foreign markets are confirming the bullish market activity in the US.
Since this uptrend is a Major wave it should subdivide into five Intermediate waves. Intermediate wave one concluded at SPX 1129 in early August. Intermediate wave two ended in late August at SPX 1040. Intermediate wave three is currently underway. The three rising Intermediate waves, during this uptrend, should subdivide into five Minor waves. We observed this wave structure during Intermediate wave one, and we are now observing it again in Intermediate wave three. Minor wave 1 ended at SPX 1149 in mid-September, Minor wave 2 hit SPX 1123 shortly thereafter, and Minor wave 3 may have just ended at the recent SPX 1184 uptrend high. The next few days of market activity should help to confirm that event.
When Intermediate wave three concludes, estimated near the OEW 1222 pivot, Intermediate wave four should provide the biggest pullback since late August. Then we are expecting Intermediate wave five to continue the uptrend into early 2011 and potentially nearing the OEW 1313 pivot. This would make this uptrend similar to the Major wave 3 uptrend in time and in price. These price levels and the time factor are, naturally, just guidelines.
SHORT TERM
Support for the SPX is at 1176 and then 1168, with resistance at 1187 and then 1222. Short term momentum ended the week coming off of a slightly oversold condition and is now rising past neutral. It is possible that friday’s retest of the SPX 1167 low ended Minor wave 4. This pullback was 17 points (1184-1167) and the short term OEW charts moved to slightly positive during the rest of the trading day on friday. Minor wave 2 pulled back from SPX 1149 to 1123 (26 points) in mid-September - so they are similar.
Overhead resistance is at the 1187 pivot, and then the bull market high pivot at 1222. Support remains at the OEW 1168 pivot and then around the SPX 1150 area, (OEW 1146 pivot). A breakdown below the 1146 pivot would make the current short term count questionable. Also, a breakdown below the 1136 pivot would put the entire uptrend count in jeopardy. On the upside, once the market clears the OEW 1187 pivot there should be little resistance, except for a pause at 1200, up to the OEW 1222 pivot. Best to your trading!
FOREIGN MARKETS
Asian markets were mixed on the week for a net gain of 2.2%. All remain in uptrends. The SSEC (China) soared 8.5%, while the NIKK (Japan) lagged -0.9%.
European markets were all higher on the week (+1.7%) and improving. Four of the five we track are in confirmed uptrends. The DAX (Germany) led +3.2% and the FTSE (England) lagged +0.8%.
The Commodity equity group were all higher for a net gain of 1.0%. All remain in uptrends. The Dow Jones World index is uptrending, made new bull market highs, and gained 1.2% on the week.
COMMODITIES
Bonds took a breather this week after four consecutive weekly gains: -0.9%. 10YR yields dropped to 2.33% on monday then turned higher to finish the week at 2.58%. There is a positive divergence on the weekly yield chart indicating a potential new uptrend in yields may be unfolding. The current downtrend has lasted an unusually long six months.
Crude continues to uptrend but lost 1.5% on the week - all of it on friday.
Gold hit another all time high this week at $1,387 and Silver nearly hit $25. While they and Platinum remain in uptrends, there is a noticeable negative divergence of all three daily charts. After such a big rally a pullback from current levels would not be surprising.
The USD continued its decline this week losing 0.2%. It has declined for five straight weeks. The USD, however, is displaying a positive divergence of its daily charts. After a four month downtrend it’s due for a bounce, or even a new uptrend. Technically, we could see USD strength, Bond weakness, and Gold weakness in this upcoming week.
NEXT WEEK
Monday kicks off the economic week with the Industrial production report at 9:15, and at 10:00 the NAHB housing price index. On tuesday we have Housing starts/Building permits. Then on wednesday, the weekly Mortgage applications and the FED’s Beige book. Thursday ends the economic week with BEA leading indicators, the Philly FED and the weekly Jobless claims. As for the FED. We have two speeches scheduled for tuesday. The first by FED chairman Bernanke in Fairfax, VA. at the market close, and the second by FED governor Duke at NYU in NYC in the evening. Best to you and yours this weekend and upcoming week.
By Tony Caldarohttp://caldaroew.spaces.live.com
After about 40 years of investing in the markets one learns that the markets are constantly changing, not only in price, but in what drives the markets. In the 1960s, the Nifty Fifty were the leaders of the stock market. In the 1970s, stock selection using Technical Analysis was important, as the market stayed with a trading range for the entire decade. In the 1980s, the market finally broke out of it doldrums, as the DOW broke through 1100 in 1982, and launched the greatest bull market on record.
Sharing is an important aspect of a life. Over 100 people have joined our group, from all walks of life, covering twenty three countries across the globe. It's been the most fun I have ever had in the market. Sharing uncommon knowledge, with investors. In hope of aiding them in finding their financial independence.
Copyright © 2010 Tony Caldaro - All Rights Reserved Disclaimer: The above is a matter of opinion provided for general information purposes only and is not intended as investment advice. Information and analysis above are derived from sources and utilising methods believed to be reliable, but we cannot accept responsibility for any losses you may incur as a result of this analysis. Individuals should consult with their personal financial advisors.
© 2005-2022 http://www.MarketOracle.co.uk - The Market Oracle is a FREE Daily Financial Markets Analysis & Forecasting online publication.