Stocks Stealth Bull Market Dow Trend Forecast into Jan 2011
Stock-Markets / Stocks Bull Market Oct 18, 2010 - 03:01 AM GMTBy: Nadeem_Walayat
 This analysis seeks to generate a trend forecast for the stocks stealth bull market into at January 2011, which follows on from the end of the Summer 2010 correction that began with the May 6th Flash Crash and ended during Septembers rally, leaving the Dow tantalisingly close to making a new bull market high, with the last close of 11,063 just 1.2% away from the closing high of 11,205 of 26th April 2010.
Last In-depth Analysis - 16th May 2010 - Stocks Bull Market Hits Eurozone Debt Crisis Brick Wall
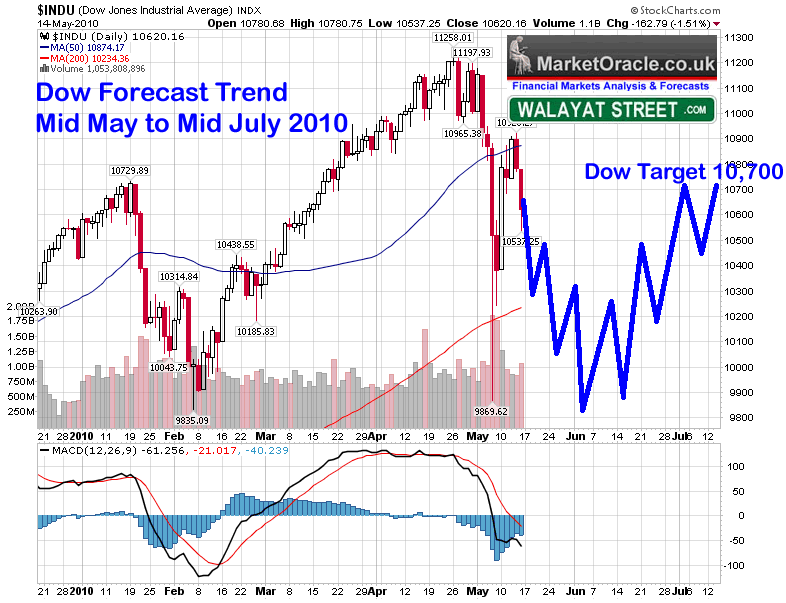
The last in-depth analysis in the series of stocks stealth bull market that began in Mid March 2009 (15 Mar 2009 - Stealth Bull Market Follows Stocks Bear Market Bottom at Dow 6,470) forecast an ABC correction to a target of 9,800 to be followed by a sideways trading that could extend all the way into early October as illustrated below:
Stock Market Conclusion
Despite the flash in the pan crash and prevailing Eurozone sovereign debt default gloom and doom, the bottom line is that this is still a stocks bull market with the Dow ONLY down less than 6% from its bull market peak. Therefore the sum of the above analysis concludes towards the stocks bull market under going its most significant and a highly volatile correction since its birth in March 2009 (15 Mar 2009 - Stealth Bull Market Follows Stocks Bear Market Bottom at Dow 6,470 ). This correction could last for several months and may extend all the way into early October, which suggests that the next 2 months are going to see an ABC correction to be followed by a sideways price action between the extremes of 10,900 to 9,800 and so despite continuing wild gyrations I would not be surprised if the Dow is little changed from its last closing price of 10,620 in 2 months time (16th July 2010). Expectations remain for the bull market to resume its trend towards a target of between 12k to 12.5k by late 2010 after the tumultuous trading period over the next few weeks. I have tried to illustrate a more precise Dow forecast projection in the below graph, reality will probably end up being far more volatile.
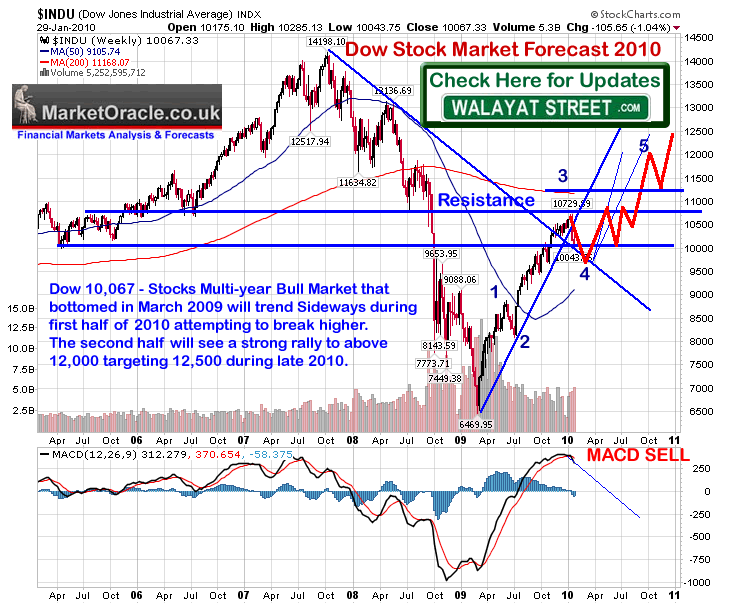
Which was inline with existing forecast for 2010 as illustrated in the January Inflation Mega-trend ebook and subsequent web posting (02 Feb 2010 - Stocks Stealth Bull Market Trend Forecast For 2010) that this analysis seeks to refine.
Dow 10,067 - Stocks Multi-year Bull Market that bottomed in March 2009 will trend Sideways during first half of 2010 attempting to break higher. The second half will see a strong rally to above 12,000 targeting 12,500 during late 2010.
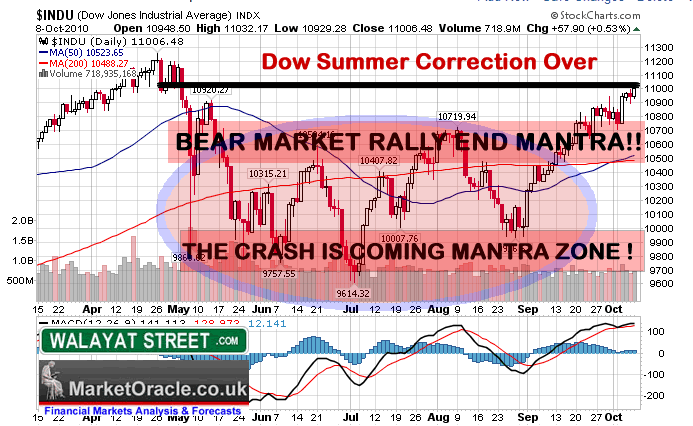
Weekly interim updates during the summer mapped out the swings within the trading range, as the Dow prepared to break above the upper end of its trading range of 10,700. Whilst heavily bearish media and BlogosFear commentary raged during the summer months that morphed from the always imminent another flash crash into June and July's Bearish Head and Shoulders price pattern, into August's imminent Hindenberg Omen Crash month, and soon replaced during September by repetitive warnings that September could be the worst month of the year on the basis of statistics and deflation when it turned out to be the BEST September for over 70 years!
(05 Sep 2010 - Inflation Mega-Trend Long-term Growth Spiral Continues to Drive Stock Market Trend )
Bottom Line - Nothing new to report short-term the Dow remains in a corrective trading range of approx 10,700 to 10,000. Everybody tells you that September is usually one of the the worst months for stocks. I say its in a range with probability favouring a break higher.
The Head and Shoulders Propaganda Pattern
Propaganda over analysis was never more evident than in the oft claimed for Head and Shoulders reversal pattern that during the whole of the summer correction pumped out warnings to investors that the H&S pattern implied that the stocks bear market resumption was always imminent, the below graph illustrates how the right shoulder mutated hunch bank of notre dame style all the way into October, and will likely continue to do so all the way to new bull market peaks.
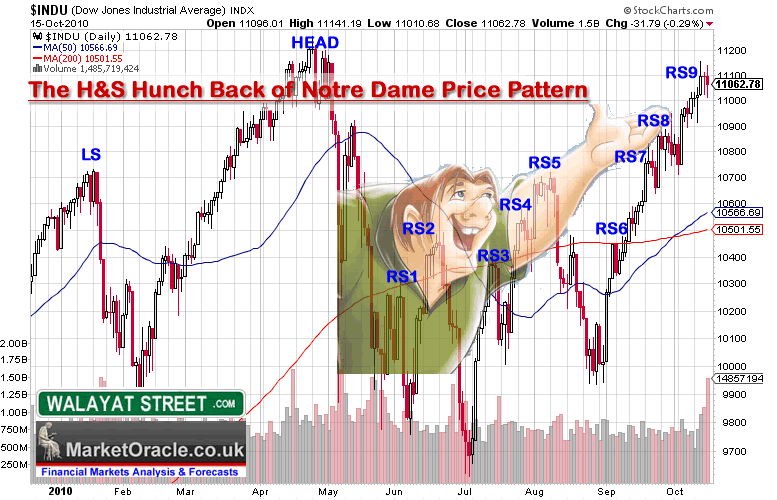
The Bottom line is that the mainstream press is 99% propaganda, and the blogosFear approximately 90% propaganda, which leads me to believe that no one in the mainstream press ever puts their money on the line and thus perpetuate delusions forever until amnesia is required to switch positions months if not years after the event, just as deflationary deflationists will eventually be forced switch to having been Inflationists all along, which also appears to hold true for approx 90% of the BlogosFear.
Hindenberg Crash Omen Proved to be the Summers Best Contrary Indicator!
The whole of August witnessed a crescendo of imminent stock market crash commentary right across the media including Barons, Bloomberg and the Financial Times on the basis of the 'Hindenberg Omen' signal, which reached its greatest intensity just as the stock market bottomed during late August 2010.
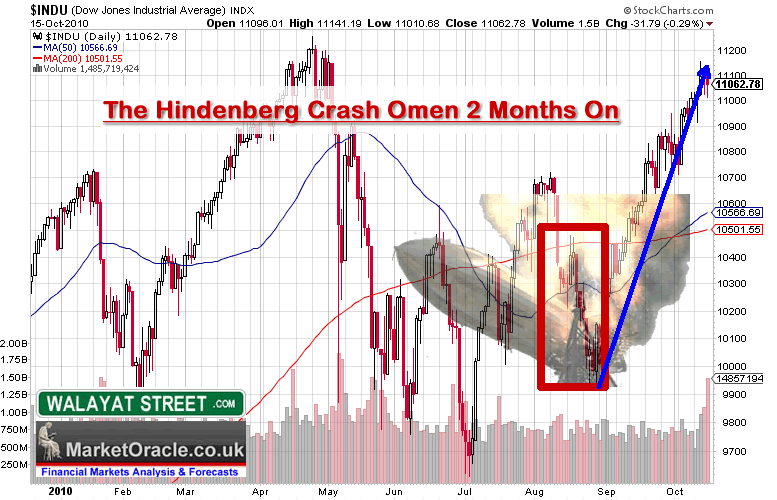
22 Aug 2010 - The Hindenburg Stock Market Omen Doomed to Crash and Burn? - Dow 10,205
The problem I see with the Hindenberg Omen and its kind is that it is too easy to generate a back fitting indicator that perfectly calls every top or bottom in hindsight but going forward requires constant revisions to make the indicator fit onto future price action, which basically means you have a 50/50 chance (or less) of the indicator going forward producing the outcome that it purports to forecast, as each time it fails the indicator is changed to allow for the reason as to why it failed which basically means fewer and fewer occurrences which does NOT mean that it becomes more accurate rather more accurately fitting the data in hindsight.
The facts are that the main proponents of the Hindenburg Omen have been WRONG throughout the WHOLE Bull market from its birth in March 2009 and subsequent 18 month trend, the perma-bears each month jump from indicator to indicator (In June and July the Head and Shoulders pattern was all the rage) all the while hoping all the past investment account busting wrong calls have been forgotten as they wait to eventually be right, even a broken clock is right twice a day.
29 Aug 2010 - Stocks Fail to Follow Crash Script - Dow 10,150
Did the stock market crash Monday ? Nope, Tuesday ? Nope. How about Wednesday, Thursday or Friday ? The Dow closed down 63 points on the week at 10,150 (10,213) which given the much publicised Hindenburg Crash Omen, is not exactly following the script though off course the Hindenburg Omen has plenty of get out of jail cards in the small print which ensures that all eventualities are covered.
A quick chart analysis shows that the break below 10,000 was not particularly healthy, and Fridays rally has yet to trigger any reversal higher, it would be an easier market to determine at this point in time if it had breached the downtrend line and closed above 10,200. The Dow is going to need to rally next week by trading back above 10,200. Okay, I am going to go with a rally early next week that breaks above 10,200 which would be inline with the existing scenario that suggests the trend pattern should now be for an assault on and break above Dow 10,700, which would confirm the higher high and generate a higher low that would target the bull market peak.
Current Stock Market Sentiment & Psychology
We are now well into October, the month of stock market panics! So bearish sentiment should be even more pronounced than usual. However, as illustrated above, the past 5 months have seen hyper bearish sentiment in the face of always imminent crisis right at Dow's trading range bottoms repeatedly being knocked back, therefore bearish sentiment is rather muted at the moment which is not such a good sign for stocks in terms of trend. Even worse, bullish sentiment has been buoyed by Bernanke's potential QE2 speech which further reinforces that the stock market is going to find immediate upside difficult and therefore a probable correction is near, which should be just enough to get the perma bear crowd to again start crowing loudly about another crash just as stocks bottom, as they have plenty to call on to support the perma bearish views such as headline grabbing "currency war", "double dip recession", "debt and deficits", and "dollar collapse", all they need is the confidence from stocks dropping a few percentage points perhaps off of a failed assault on Dow 11,250. Since the QE2 talk is centred around Nov 3rd, it is highly likely that stocks will be in a downtrend that is declining through that date.
Therefore investor sentiment suggests immediate upside is limited with a relatively minor correction more probable to setup bearish investor sentiment ahead of the next big rally.
The Stocks Stealth Bull market and Elliott Wave Theory
My unorthodox (no tenants) interpretation of Elliott Wave Theory has proved reliable for the duration of the stocks stealth bull market from its birth in March 2009 in gauging the probable trend for the Dow as illustrated at length in the January Inflation Mega-trend Ebook (FREE DOWNLOAD).
My last in depth analysis (16th May 2010 - Stocks Bull Market Hits Eurozone Debt Crisis Brick Wall) concluded that the April high was a fifth wave peak that targeted a A-B-C correction towards a summer low in the region of 9,800.
ELLIOTT WAVE THEORY- The EWT pattern has concluded towards a 5th wave peak by early to Mid May as illustrated by the March 23rd 2010 Chart above. Which concludes in an EWT pattern that will seek to correct the whole bull market trend off of the March 2009 low i.e. the most significant correction to date. The normal EWT expectation is for an ABC pattern for a lower C low. Which on face value suggests a break of the 9,870 Flash Crash low, to complete the ABC pattern in advance of the resumption of the bull market trend higher.
Subsequent price action confirmed the the ABC pattern, with the Dow bottoming at 9,614 at the start of July.
Elliott Wave Price & Time Analysis
Current EW Analysis -
- The 5 Major Wave advance from March 2009 to April 2010 took 13 months.
- The subsequent ABC correction to the end June took 2.5 months
- Major Wave 3 was the largest, Major Wave 1 Was the shortest.
- Current sub wave 3 rally has resistance at 11,258.
If the Dow followed a similar trend for the next phase of the stocks stealth bull market, then that would suggest that the bull market targets an uptrend into August 2011, with the subsequent significant correction into late October / Early November 2011. Furthermore the rule of alternation suggests that Wave 3 should be the shortest and Wave 5 the longest, with Wave 1 somewhere in between (current Wave).
Wave 1 Rally off of Dow 9,614
Sub waves 1 & 2 formed part of the anticipated trading range of 10,700 to 10,000. The current minor wave 3 should be coming to an end soon that targets a short wave 4 correction, to be followed by a minor wave 5 rally to complete the larger Wave 1.
Elliott Wave Conclusion
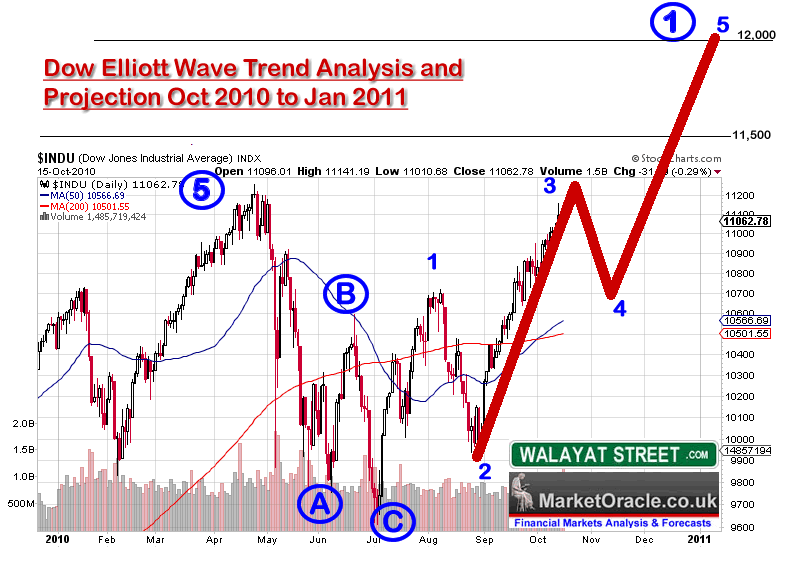
EWT suggests a short correction (minor wave 4) is likely to start around resistance at the bull market high of 11,258, after which a rally targets Dow 12,000 by late Dec / early Jan 2011 (minor wave 5) that reinforces the long standing concluding forecast for a rally to Dow 12,000 to 12,500 by late 2010.
The Dangers of Being Seduced by Elliott Wave Theory
Now, despite my interpretation of Elliot Wave analysis having proved highly accurate since the March 2009 low and the above also very convincing on where the Dow could trend not just into end 2010 but all the way into Mid 2011. However, before you start thinking that EWT maybe the 'holy grail' of analysis, take note that EWT Analysis on its own is just ONE component, and therefore one should not let oneself become seduced by what is highly seductive in the ease to which multiple junctures can be extended into the far distant future, which is how the highly public self professed Elliott Wave Gurus like it to be seen to be, though many of whom have apparently missed THE WHOLE STOCKS BULL MARKET and suffer from permanent amnesia! which should send anyone's alarm bells ringing! Therefore Elliott Wave Theory, whilst continuing to strongly imply a bull run is expected to continue towards Mid 2011, however on it's own, in the long-run it is NOT going to be more accurate than a coin toss! The conclusions no matter how convincing of ANY single Component tool NEED to be confirmed by other fundamental and Technical analysis so as to arrive at a more probable final conclusion.
Therefore despite EWT being a useful tool, I am ALWAYS on guard against being seduced by EWT as it is extremely easy to back fit onto what has already happened to imply something highly probable is about to take place when the complete opposite may be true. So yes, whilst it's implications can get the adrenaline pumping! I do take deep breaths and remember that there are NO short cuts! NO matter how enticing it appears, on its own EWT in the long-run CANNOT be more accurate than COIN TOSS !
Always keep in your mind that the EWT component Equates to a Coin Toss Over the Long-run and you won't become seduced and end up missing whole bull markets as MANY so called MASTER ELLIOTTITIONS have proceed to do ! Because they believe their own hype, much as gannophiles have been seduced by the master price time squares that is yet again another example of coin flip analysis elevated to 'holy grail' high priesthood status.
So what's next? How about another good contrary indicator?
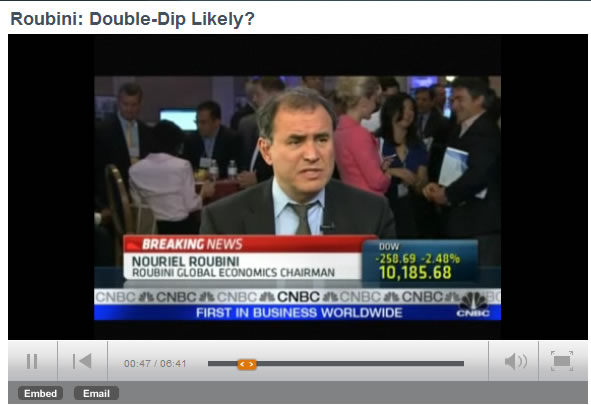
Nouriel Roubini Calls for a 20% Drop in the Stock Market
Though it was in late May 2010!
Roubini stated that he expected the stock market to sell off by 20% over the next few months and a double dip deeper recession. He made some recommendations including buying put options, investing in cash and short-term government bonds of countries such as Germany and Canada, he also expects the Euro and commodities to fall over the next few months.
Nouriel is proving to be a GREAT contrary indicator (23 May 2010 - Nouriel Roubini Stock Market 20% Drop Forecast, Time to Buy? ).
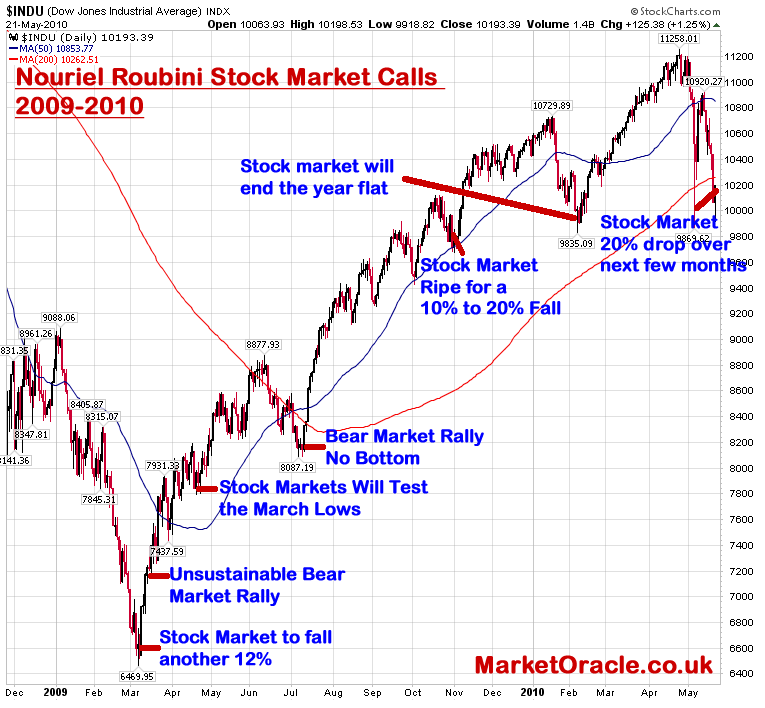
What is Nouriel's most recent take on the prospects for the economy and stocks?
Double Dip Recession 40% Chance, Deflation risks - Bloomberg - 14th October
Hmm, nothing on stocks, just repeating the same BS over and over again as if stating there is a "40% chance" has ANY VALUE! People want to hear if something IS or IS NOT going to happen, not 40% which means NOTHING!
Damn, my best contrary indicator has let me down by keeping his mouth shut on the stock market! Though, he has a tendency to speak AFTER the market has fallen which makes sense as to why he has remained silent during the ongoing rally, so perhaps we will next hear from Nouriel on stocks in early November.
Quantitative Easing AKA Money Printing
The stealth theft of wealth by inflation is getting another accelerant in the form of direct money printing by the US Fed to the tune of another round of $1.5 trillion print run (electronic) to monetize the U.S. budget deficit that comes in at $1.3 trillion and likely to continue in the range of approx 1.5 trillion a year for a decade. Confirmation of QE2 will come on Nov 3rd, as ever it will be a case of sell on or ahead of the news therefore as mentioned earlier stocks should decline.
Whilst many "so called analysts" had convinced themselves earlier in the year that QE had come to an end. However my conclusion remains for over 2 years now that once Quantitative Easing starts it cannot end whilst large budget deficits exist regardless of what the central bankster's publically state, as their focus is in massaging the expectations of the general population and financial markets with regards positive expectations on the economy and inflation and NOT in publicising accurate projections, as that would make their jobs much harder as I elaborated upon a couple of months ago (13 Aug 2010 - The Real Reason for Bank of England's Worthless CPI Inflation Forecasts ).
The facts are and have remained for over a year that QE is INFLATIONARY, which ultimately means HIGHER INTEREST RATES, which I will come back to in a later section on bonds. Though its not just the U.S., they are ALL at it, the UK will probably be next to follow as it continues to utilise inflation as a stealth tax on the British population.
Implication for stocks - Apart from "sell on the news", QE2 is BULLISH as it reinforces the primary bull market trend into at least year end.
The Deflation Delusion
I won't bore you by repeating what I have already written at length for the past year dating back to November 2009, so refer you to a selection of key articles below and the Inflation Mega-Trend Ebook (FREE DOWNLOAD)
- 19 Sep 2010 - UK Government Stealth Debt Default Continues at Minimum Rate of 3% per Year
- 26 Aug 2010 - Deflation Delusion Continues as Economies Trend Towards High Inflation
- 05 May 2010 - Greece Economic Depression Resulting in INFLATION NOT DEFLATION Surge
- 27 Dec 2009 - UK CPI Inflation Forecast 2010, Imminent and Sustained Spike Above 3%
- 18 Nov 2009 - Deflationists Are WRONG, Prepare for the INFLATION Mega-Trend
The conclusion is that deflation expectations have ALWAYS BEEN delusional as the worlds central banks will not allow for deflation to occur as that weakens governments as the value of debt and debt financing rises, however the deflation delusion does allow the central banks to get away with printing money to first inflate asset prices and eventually consumer prices (we have been at that stage in the UK for 9 months now). The implications for stocks are bullish as inflation money printing pumps up asset prices as well as corporate profits, against which delusional deflationists have rabbited on and on about non Existant deflation to manifest in an always imminent resumption of the stocks bear market, which will continue all the way towards Dow 12k and probably beyond!
The latest manifestation of the delusion is to point to Gold now soaring towards $1400 as a manifestation of deflation when the complete opposite is true! Gold just illustrates to the extent to which inflation has already been created by deficits and QE to date!
The Currency Wars Big Secret!
The mainstream press is currently obsessing over China and others for manipulating their exchange rates against the U.S. Dollar that is painted as the innocent victim, with self righteous politicians in indignation calling for action to be taken against the evil currency manipulators. When in actual fact the likes of the Chinese are more like rabbits frozen by fear, trying hard not to become road kill in the face of Fed actions and Congress's endless deficit spending debt accumulating binge with the worlds reserve currency.
Contrary to the way the financial world may be presented in the mainstream media, the Fed is at the head of the global central banking syndicate that runs the show Don Vito Corleone style, where should any foreign central banks get out of line, will soon be in for a currency markets massacre as they see their currencies soar thus destroying their ability to export that their economies are addicted to drug addicts style, as the official policy of the U.S. since the midst of the cold war has been to control the worlds financial system by means of operating a continuous large trade deficit, as covered at length in last weeks article (12 Oct 2010 - USD Index Trend Forecast Into Mid 2011, U.S. Dollar Collapse (Again)?).
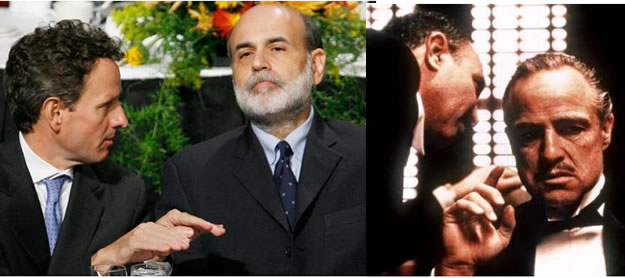
Whilst many in the mainstream press have finally clocked onto the fact that the Fed intends to inflate (about a year behind the curve), what no one appears to have clocked onto so far is that the BIG SECRET is that the Fed intends on INFLATING THE WHOLE WORLD ! It is pushing the worlds governments reliant on exporting to the U.S. into devaluing their currencies by means of printing money.
Thus against the Fed INFLATE or DIE policy, all foreign central banks are fighting hard to maintain their pegs to the downwards spiraling U.S. Dollar, which effectively means that all currencies are spiraling lower hence the whole world is inflating at the Feds whim. For instance emerging markets such as Brazil are crying that they are being flooded with too much foreign capital that is driving up their currencies, therefore they are forced to print and burn their own currencies i.e. INFLATE! (are you listening delusional deflationists ?) THE FED IS INFLATING THE WHOLE WORLD!
Those that have constantly been calling for the Dollar to collapse still don't get it that despite having been wrong for the past three years that ALL currencies are spiraling lower together. Therefore trends as exhibited by the USD index is just volatility in the differing relative rates of free fall between currencies.
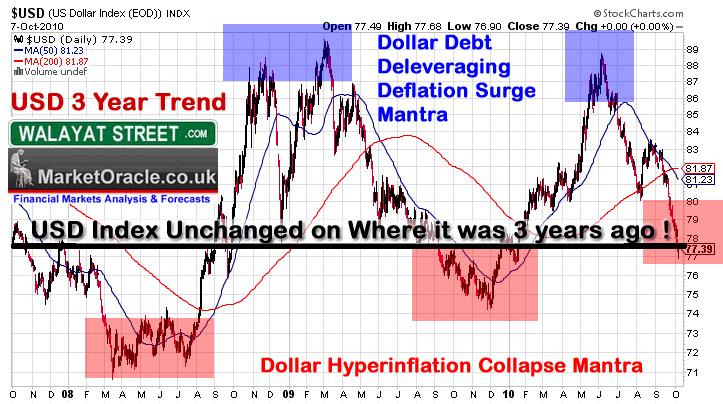
What does this mean for the stock market?
Nothing has changed since the stock market bottomed in March 2009, or since the Inflation Mega-Trend ebook of Jan 2010 - The stock market like all other asset markets is leveraged to consumer prices and hence will continue to trend higher as the purchasing power of all currencies fall.
The U.S. Dollar and the Dow
The earlier USD index in-depth analysis (12 Oct 2010 - USD Index Trend Forecast Into Mid 2011, U.S. Dollar Collapse (Again)? ) concluded in the following trend expectation for the U.S. Dollar into mid 2011.
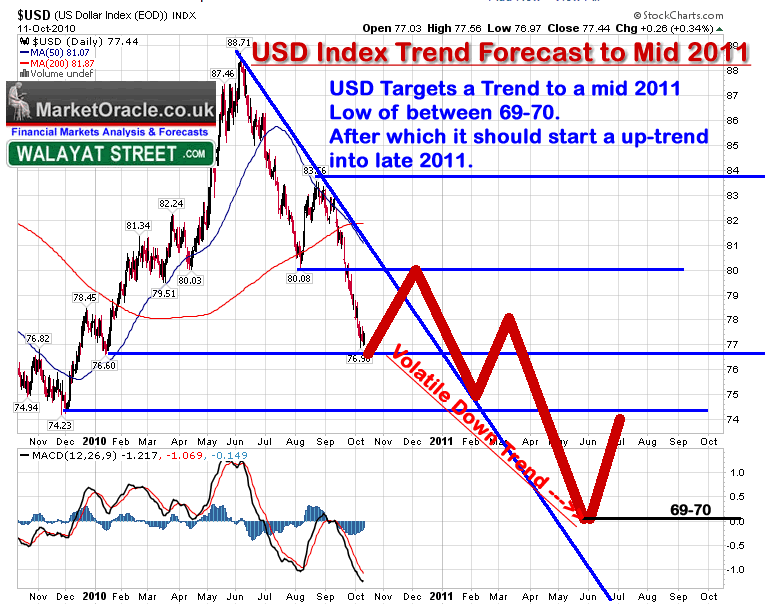
The impact of a falling USD on the stock market is two fold.
1. It inflates the dollar value of US stocks as they fall in value in foreign currencies.
2. It inflates the dollar value of foreign earnings and hence boosts U.S. corporate earnings.
The above USD trend therefore supports the stocks bull market trend into mid 2011.
US Economy and Military Empire
The U.S. economy is suffering under the weight of an ever expanding military empire that it both cannot afford or monetize upon hence why the U.S. trade deficit will continue regardless of what the politicians state as there is no sign to the deleveraging of the global U.S. military empire that exists purely for the purposes to serve the military industrial complex which is the true power behind the throne in Washington, and that which includes Wall Street as one of its tentacles.
The U.S. military industrial empire's grip on the U.S. government is never more evident in fact that whilst the US is expending lives and treasure on countries such as Afghanistan to stabilise them after contributing to the chaos, so does the U.S. allow competing countries such as China to enter and gain economic advantage whilst under the protection of U.S. forces, as is taking place in Afghanistan.
What is the point of paying for an empire of you don't reap the economic rewards of military occupation? All that is happening is that U.S. tax dollars are being expended in all aspects without any output i.e. for consumption, whilst China is making instant profits through trade and infrastructure building.
Off course having a global military presence plays its role in supporting the U.S. Dollar as the worlds reserve currency.
This suggests real growth for the whole of the next decade in the U.S. will be low, therefore most of the growth will be nominal, i.e. as a consequence of INFLATION and as asset prices are leveraged to consumer prices means a bullish stock market trend for the next decade. How high? Well we can expect the annual QE announcements to deliver that answer!
US Unemployment
Corporate profits are soaring along with the stock market whilst US unemployment remains high, how can that be ?
Well, it basically means that corporate profits are not being plowed back into employing new workers, instead companies as a consequence of the credit crisis continue to hoard cash and increase their liquidity, eventually these cash mountains will be used. Unfortunately it will probably be used to buy other companies which means pumping up stock prices. So the jobs outlook as far as I can see will continue to look bleak, especially as the U.S. needs to create 100,000 jobs per month just to stand still.
The unemployed are REALLY going to suffer as they are squeezed by INFLATION.
If your job hunting in the U.S. (and Europe) then your best bet is to change your mindset from being a worker bee into being an entrepreneur bee.
U.S. Treasury Bond Bubble, Stocks and Q.E.
My in-depth analysis during August warned of the U.S. Treasury bond bubble that was primed to burst (26 Aug 2010 - Deflation Delusion Continues as Economies Trend Towards High Inflation ) since which time US bonds have been wobbling towards a break of September's low, with currently Bond investors having in actual fact lost about 12% of the real value of their bonds since the August Bond market peak i.e. bond price + dollar devaluation, with far more to come as the forecast graph below illustrates.
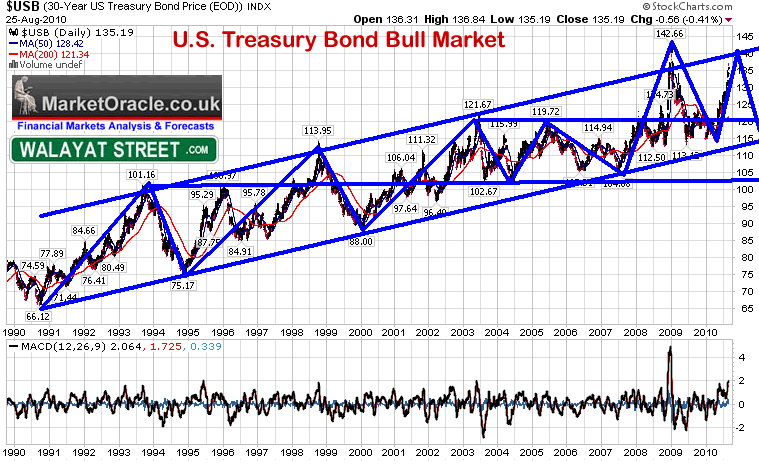
Whilst implementation of QE2 may lead to a bounce in bond prices as effectively the Fed is saying we are going to buy a load of government bonds. However this will prove temporary as each new round of QE will prove less effective and more inflationary. Falling bond markets mean rising market interest rates which will eventually force the Fed and other central banks to start raising their rates as the real economy will be in a far more robust shape than the official data will suggest. Much as I warned 2 months ago that the "The Bank of England WILL RAISE INTEREST RATES AND PRINT MONEY" The same holds true for the Fed.
Consensus Interest Rates Myth Busted
The long-standing consensus view is that rising interest rates are bearish for stocks and falling interest rates are bullish, therefore many are now concluding that rising U.S. interest rates will be bearish for stocks and thus trigger the long awaited for bear market to resume.
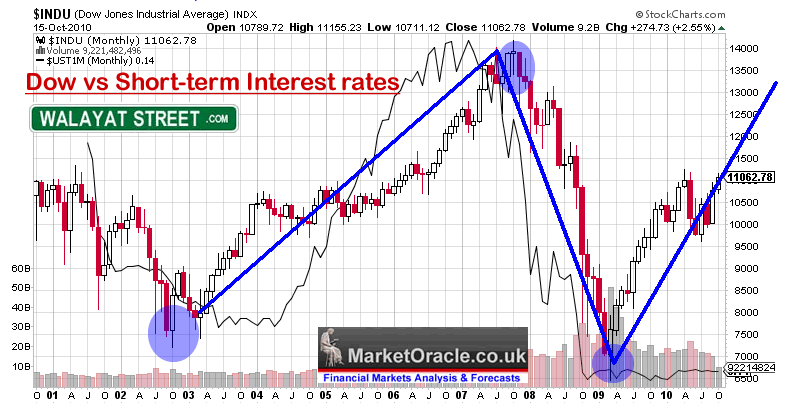
Well contrary to what you are repeatedly told, RISING interest rates are NOT bearish for stocks and FALLING interest rates are NOT bullish, which is illustrated by the above graph. In fact the chart also implies that stock market rallies LEAD interest rates higher rather than interest rates leading stocks which is again another consensus myth that does not match reality. The reason for this is because rising interest rates are a sign of a strengthening economy, and falling interest rates are a sign of a weakening economy and thus stocks react BEFORE evidence of economic strength materialises which is when interest rate decisions are taken as a lagging action. This implies that RISING interest rates WILL NOT HAVE A NEGATIVE IMPACT on the stock market as the STOCK MARKET LEADS INTEREST RATES HIGHER.
- When interest rates are high - Stocks are in a bubble and Bonds are cheap.
- When Interest rates are low (like now) Bonds are in a bubble and stocks are cheap (no matter what the P/E says or where the index is at)
Bottom Line - The current situation in advance of rising interest rates is highly bullish for stocks for several more years!!
DOW TECHNICAL ANALYSIS
TIME ANALYSIS - The summer 5 month correction followed the 13 month bull run which came in precisely inline with my May expectations i.e. (This therefore suggest that the current correction could last over 4 months).
The current phase of the bull market targets a rally of between 13 and 5 months which averages to 9 months to target May/June 2011.
Bear Market and the 1930's Stock Price Chart Pattern - The early 1930's stock price pattern that was being plastered all over the net has now been dropped in favour of the 1938 price pattern, just as I have been warning it would be since April 2009. At the end of the day fitting past price charts onto the present ONLY works in hindsight and are totally worthless when it comes actually trying to determine and monetize on trends so plays no part in this analysis.
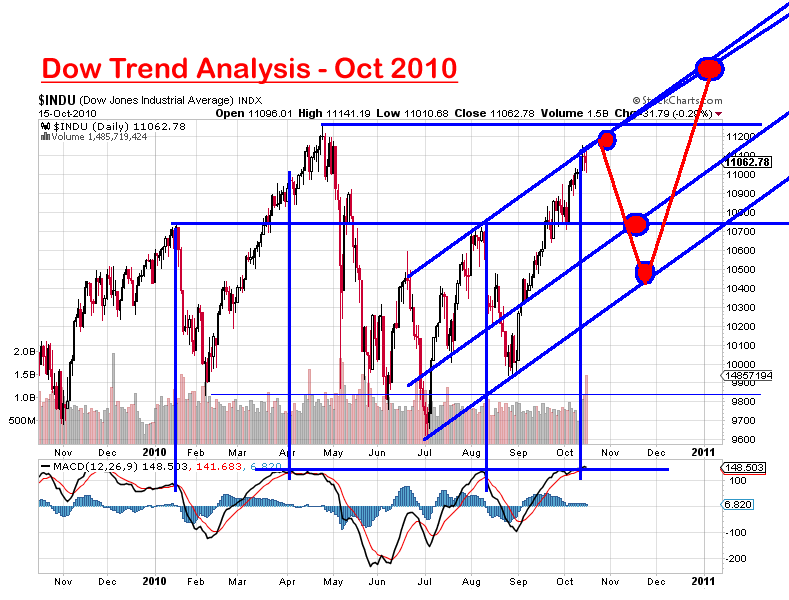
TREND ANALYSIS- The Dow is hitting the upper boundary of the up channel line, therefore suggests it is not going to be able to push significantly higher in the immediate future, which also suggests it may not reach the 11,258 high before correcting. A correction would first target 10,700 and then 10,500. A resumption or continuation of the bull run targets approx 11,700 by late 2010 and higher going into January 2011.
GLOBAL STOCK MARKETS
- China's stock market soared by over 10% during the past week to reach resistance that suggests the market should pause at just below 3,000, which fits in the building scenario for an imminent short-term correction in preparation for a breakout higher.
- UK FTSE at 5703 continues to shadow the Dow and is similarly within striking distance of its high of 5,833.
- CAC at 3,845 has breached summer resistance though significantly below its high of 4,086, which is reflective of a weak economy, looks like France is in for trouble ahead.
- Canada has soared to a new bull market peak of 426 (413), acting as a leading indicator for the Dow.
- German DAX has soared to a new bull market peak of 6,492 again confirms the relative economic strength of Germany
DOW GOLD - A number of analysts obsesses over the Dow / Gold Ratio as if it means anything. The bottom line is you cannot buy Dow stocks with Gold and nor can you buy Gold with Doe stocks. You might as well price Dow in pork bellies or wheat, or any other commodity for it has no relevance. For there to be a relevance markets have to be in the same sector i.e. Dow compared to global stock market valuations.
MARKET INTEREST RATES - The interbank LIBOR market has eased from the May 2010 Eurozone debt crisis extremes of 0.35 to 0.26 which is set against the bull market normal rate of 0.24. This implies an outlook for a much calmer stock market ahead, as the LIBOR rate continues to ease towards 0.24 and therefore as long as the status quo continues it is positive for an overall bullish trend for stocks.
SUPPORT / RESISTANCE- Resistance is clearly at the preceding high of 11,258, which given the near 6 months since the April peak implies that it should not be able to break it on first attempt i.e. implies failure and correction. Support clearly lies at 10,700 which had marked the upper end boundary of the summer trading range, therefore is a natural target for a Dow correction.
MOVING AVERAGES - The Dow is trading above its 200 day and 50 day moving averages which now act as support at 10,500 to 10,550.
PRICE TARGETS - Upside price targets resolve towards 11,260 and 11,750 to 12,000. Downside price targets resolve towards 10,700 and 10,500.
MACD - The MACD is signaling that the stock market is overbought and that a correction should be imminent. Higher highs and lows confirm the bull trend.
VOLATILITY - Stock Market volatility as measured by the VIX has fallen back from a peak of 48 made just after the Flash Crash of May 6th to just 18, which further confirms that the stock market is primed for a sustained bull run as a low and falling VIX will be taken as a cue by investors that potential rewards out weigh the risks.
VOLUME - Volume has continued to remain WEAK throughout the rally, which has been one of the main reasons why so much commentary has been bearish during the past 18months! However it is perfectly inline with that of a stocks stealth bull market as it implies that this rally has mostly NOT been bought into. Therefore I continue to expect heavier volume on the declines and lighter volume on the rallies all the way to new bull market highs.
SEASONAL TREND - Sell in May and Go Away worked a treat this year. The seasonal pattern now suggests a low in late October to be followed by an uptrend into May 2011, which tallies closely with the rest of the analysis above.
PRESIDENT CYCLE YEAR 3 - The Third year of Barack Obama's presidency is approaching (has it really been that long?). A statistical analysis reveals that most of the third year (into June) tends to be a great period for stocks showing an average gain of 20%,
STOCK MARKET CONCLUSION
Stocks remain in a MULTI-YEAR BULL MARKET that is being driven higher either by corporate earnings surprises to the upside OR MONEY PRINTING in the face of weak main street economic activity. It does not matter which is prevalent at a particular point in time as the market SPIRALS HIGHER in reaction to both waves of INFLATIONARY buying pressure, something that the dark pools of capital recognised right at the birth of the Stocks Stealth Bull Market in March 2009 (15 Mar 2009 - Stealth Bull Market Follows Stocks Bear Market Bottom at Dow 6,470 ) and have since been eager to bid the stock market higher whilst MOST have FAILED to participate on the rally to date (if not been engaged in betting against it) and will continue to do so all the way to new bull market highs which is why this remains STOCKS STEALTH BULL MARKET.
The same INFLATIONARY forces are driving up ALL assets such as commodities, whilst at the same time holding up other weaker assets such as housing that should be in free fall as the bubble baton is passed from one asset class to another.
In our fiat currency, big government deficit spending, debt accumulating world, governments CANNOT ALLOW FOR DEFLATION, not only that but inflation can literally always be created at the press of a button, therefore as asset prices are leveraged to consumer prices that is where wealth protection strategies should be focused.
STOCK MARKET FORECAST FINAL CONCLUSION
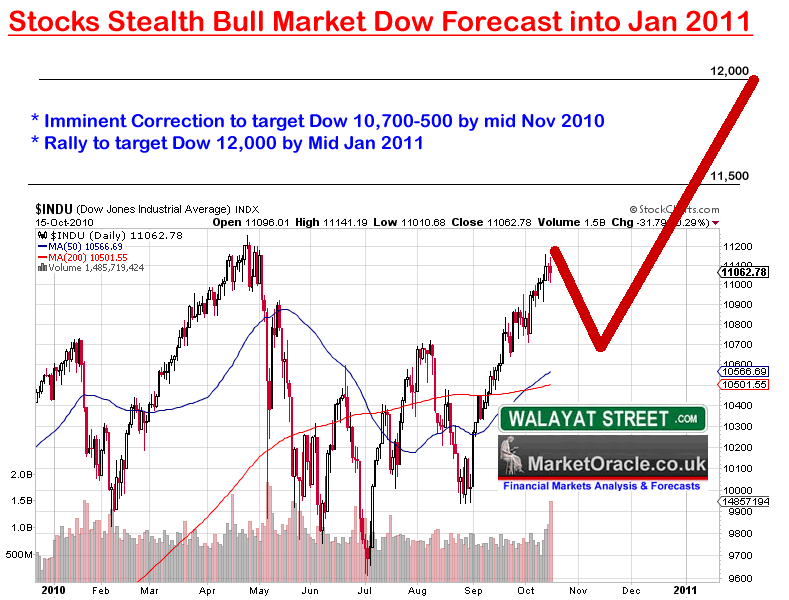
Everything appears to be in synch! All of the above (and linked) analysis together lead me to the following trend conclusion for the stock market as measured by the DJIA30 index - The Stock market is heading for an imminent correction which means it may not be able to reach resistance at 11,250 before correcting which targets a trend to 10,700-10,500 by mid November, that I expect to resolve in an uptrend into January 2011 that targets Dow 12,000 as illustrated by the below graph, and therefore confirms the original forecast target for the Dow as of January 2010. Also an interim analysis for 2011 suggests that the Bull run could continue into May/June 2011 (more on this in late December).
Risks to the Forecast
That the perma-bears and all the Doctor Dooms (apparently a number go by the title) are eventually proven right (though if they had followed their own advice they would have gone broke long ago!).
The real risk is that sentiment turns strongly bullish which would imply a weaker uptrend than anticipated and hence a lower high for the Dow than projected i.e. perhaps only 11,600 by early Jan 2011.
1987 Stock Market Crash Anniversary
Tomorrow is the 23rd anniversary of the 1987 Stock Market Crash, perhaps I should have waited 24 hours before pressing SEND!
I had hoped that I would have had the time to write an in-depth article on the real secrets of successful trading, which is now left for another time.
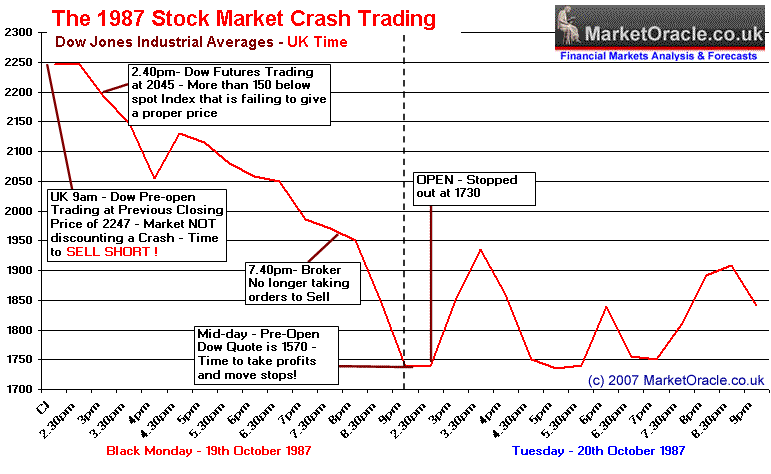
For 1987 crash day trading experience see 1987 Stock Market Crash
Your stocks stealth bull market trend monetizing analyst.
Comments and Source : http://www.marketoracle.co.uk/Article23571.html
By Nadeem Walayat
Copyright © 2005-10 Marketoracle.co.uk (Market Oracle Ltd). All rights reserved.
 Nadeem Walayat has over 20 years experience of trading derivatives, portfolio management and analysing the financial markets, including one of few who both anticipated and Beat the 1987 Crash. Nadeem's forward looking analysis specialises on UK inflation, economy, interest rates and the housing market and he is the author of the NEW Inflation Mega-Trend ebook that can be downloaded for Free. Nadeem is the Editor of The Market Oracle, a FREE Daily Financial Markets Analysis & Forecasting online publication. We present in-depth analysis from over 500 experienced analysts on a range of views of the probable direction of the financial markets. Thus enabling our readers to arrive at an informed opinion on future market direction. http://www.marketoracle.co.uk
Disclaimer: The above is a matter of opinion provided for general information purposes only and is not intended as investment advice. Information and analysis above are derived from sources and utilising methods believed to be reliable, but we cannot accept responsibility for any trading losses you may incur as a result of this analysis. Individuals should consult with their personal financial advisors before engaging in any trading activities.
Nadeem Walayat Archive |
© 2005-2022 http://www.MarketOracle.co.uk - The Market Oracle is a FREE Daily Financial Markets Analysis & Forecasting online publication.


