


Global Stock Markets Weekend Elliott Wave Analysis Update
Stock-Markets / Elliott Wave Theory Oct 23, 2010 - 09:27 AM GMTBy: Tony_Caldaro

 Economic reports and the equity market ended the week mostly positive. On the economic front; industrial production, building permits and weekly mortgage applications all declined. Capacity utilization and the BEA leading indicators were positive but flat. There were improvements, however, in the NAHB housing price index, housing starts, weekly jobless claims, the Philly FED, the WLEI, the monetary base and the M1 multiplier.
The SPX/DOW gained 0.60%, and the NDX/NAZ gained 0.35%. Asian markets lost 0.5%, European markets gained 0.9%, the Commodity equity group lost 0.6%, and the DJ World index lost 0.2% on the week. Bonds were +0.2%, Crude gained 0.4%, Gold lost 3.0%, and the USD gained 0.6%. Next week will be highlighted by housing, the Q3 GDP, and the Chicago PMI.
LONG TERM: bull market
This week we take another view of the equity market - the international view. When I first started tracking the markets using OEW in the early 1980′s my view was kind of myopic. I did take a long term view of the stock market, but only the US market. In those days, nearly three decades ago, the world was not as interconnected as it is today. As result I was able to do just fine during the 1980′s. Nowadays things are totally different.
Today one needs to take a panoramic view of the stock market(s). This implies that not only one’s own market and its sectors be tracked, but many of the foreign markets as well. Most markets, these days, move in unison not in isolation. Therefore, if one believes their stock market is in a bull or bear market they should review several major foreign markets for confirmation. A market is generally not going to go in one direction while the majority of the foreign markets are heading in the other.
When we analyze the US stock market and its sectors. We are also analyzing five Asian markets, four European markets plus a european composite index, three commodity driven equity markets and a worldwide composite index. That’s 15 separate stock markets/indices in total. What we find is that one region, or the other, leads or lags from time to time. Yet longer term, they almost always appear to move together in bull markets and in bear markets. Not only this, but many will have the same OEW wave count as well. From our perspective, the interconnectedness of the world markets is far greater than most imagine. To display this point we offer charts of five separate stock markets – all with the same or very similar OEW wave counts. Please note, of the 15 world markets we track 12 have clearly bullish wave counts.
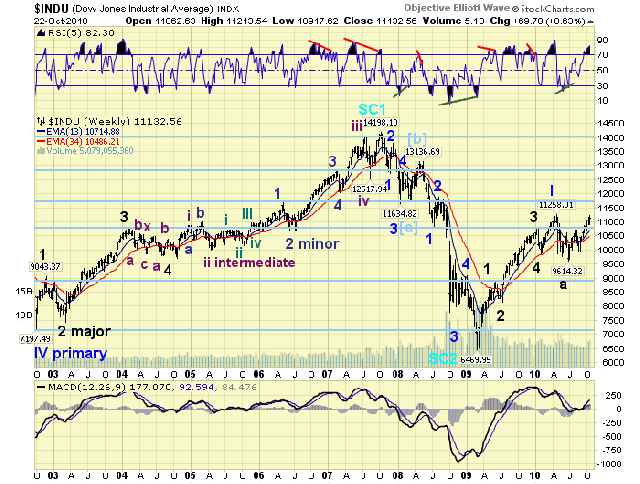
The first one presented is the DOW. This count from Mar 2009: five Major waves ending Primary wave I, then a Primary wave II, followed by the current Major wave 1 of Primary wave III, you are all familar with.
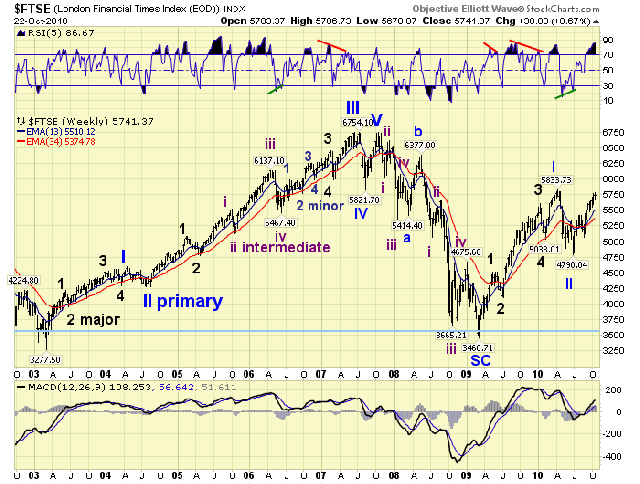
Next we present England’s FTSE. Notice it has the same exact count.
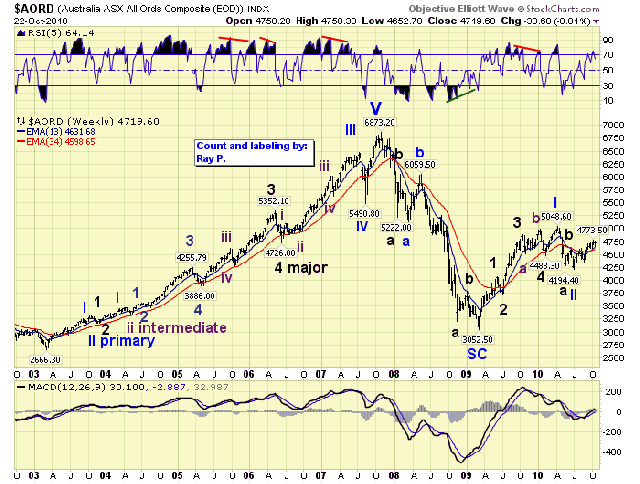
Next we present the Asian market of Australia’s ASX. This time a very similar count.
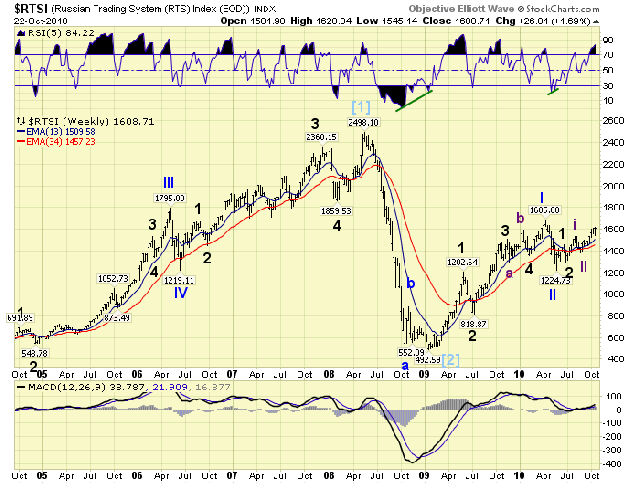
Next one is of our Commodity equity group, Russia’s RTSI. Again a similar count.
Finally to conclude we display the Dow Jones World index. This count is identical to the first two, the DOW and the FTSE.
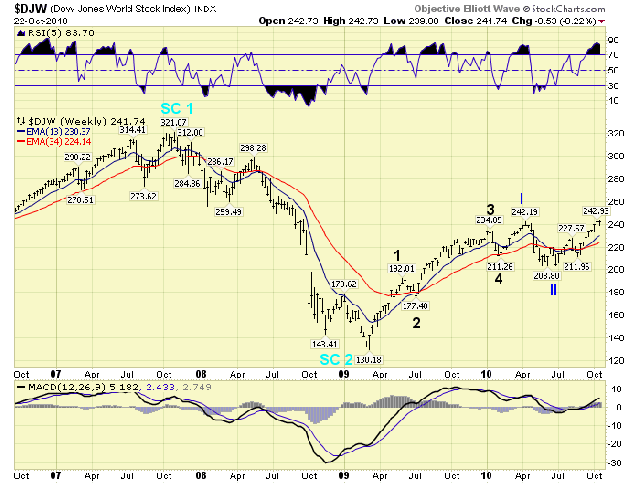
These five separate market indices: the US, Europe, Asia, Commodity and the World are all in bull markets, with very similar counts. Seven of the other ten stock markets we follow have wave counts very similar to these five. Our conclusion, when 80% of the world indices we follow are clearly rising in similar patterns, is that this bull market is a worldwide event.
MEDIUM TERM: uptrend high at SPX 1189
This uptrend started in the first few days of July, and here we are entering the last week of October and it is still working its way higher. In fact, the SPX has made new uptrend highs for six weeks in a row. It is easy to overlook these kinds of statistics when tracking the markets day by day. Nevertheless, the SPX hit 1189 this week – its highest level since the open on May 5th. Checking the charts. The monthly RSI/MACD continue to climb. The weekly MACD is climbing and the RSI is starting to get overbought.
During this bull market the weekly RSI has ended its three uptrends in one of two fashions. Either an extremely overbought condition – this was the Feb10 to Apr10 uptrend. Or, a negative divergence top – this occurred during the first two uptrends. Since this somewhat choppy uptrend is more similar to the first two uptrends than the straight up Feb-Apr uptrend. We’re expecting a negative divergence conclusion in the weekly RSI. This will require a decline at some point, of some degree, and then new highs with failing momentum. Should the market momentum shoot straight up to extremely overbought, then this expection would become questionable.
Since this uptrend is Major wave 1 of Primary wave III it should unfold in five Intermediate waves. Intermediate wave one ended in early August at SPX 1129. It rallied 118 SPX points, from 1011 to 1129. Intermediate wave two was quite a drop, but found support at SPX 1040 at the end of August. Intermediate wave three appears to have concluded this week when the SPX hit 1186 on monday. This rally travelled 146 SPX points, more than Int. one. This allows Intermediate wave five to be shorter, longer, or somewhere in between. When Intermediate wave four concludes we can make some projections. Overall we have been expecting this uptrend to continue until Jan11 and hit the OEW 1313 pivot. This is still possible/probable.
After SPX 1186 was hit on monday the market pulled back to SPX 1160. This pullback appeared to have started Intermediate wave four. By thursday, however, the SPX made a new uptrend high at 1189. We continue to favor the SPX 1160 low as wave A, and this recent high as wave B of an irregular correction. Naturally, we could be getting an extension to Intermediate wave three as well. Yet, as of friday’s close we do not see this in the charts. Remember: anticipate, monitor, and then adjust if required.
SHORT TERM
Support for the SPX remains at 1176 and then 1168, with resistance at 1187 and then 1222. Short term momentum ended the week slightly above neutral and rising. Our short term wave count for Intermediate wave three is posted on the hourly chart in the link below. It’s the first chart.
We counted five Minor waves up from the Int. wave two low at SPX 1040: Minor 1 SPX 1149, Minor 2 SPX 1123, Minor 3 SPX 1184, Minor 4 SPX 1167 and then Minor 5 SPX 1186. It is possible that Minor wave 4 was an irregular correction starting at SPX 1184 and concluding at SPX 1160. This would explain the rally to new uptrend highs – Minor wave 5.
On the upside. If the market clears the OEW 1187 pivot, which has been tested unsuccessfully three times and this is the fourth, then the Minor wave 5 scenario is likely underway. On the downside. Initial support is at the 1176 and 1168 pivots. More important support is around SPX 1150, the OEW 1146 pivot, and then the 1136 pivot. Should this last pivot fail, then the current uptrend count would be in jeopardy. Best to your trading!
FOREIGN MARKETS
Asian markets were mostly lower on the week for a net loss of 0.5%. All remain in uptrends.
European markets were all higher on the week for a net gain of 0.9%. All are in uptrends.
Commodity equity markets were mostly lower on the week -0.6%. All are in uptrends.
Dow Jones World market lost 0.2% on the week and is in an uptrend.
COMMODITIES
Bonds were +0.2% on the week. 10YR rates still look like they are trying to uptrend.
Crude gained 0.4% in a very volatile week. The uptrend here continues.
Gold did pullback as expected -3.0% on the week. Now nearly oversold, expecting the uptrend to resume shortly.
The USD did rally this week as expected +0.6%. Still downtrending however.
NEXT WEEK
A busy economic week kicks off with Existing home sales at 10:00 on monday. Tuesday, we have Case-Shiller home prices, Consumer confidence and then the FHFA home price index. On wednesday, Durable goods orders and New home sales. Then on thursday the weekly Jobless claims. On friday our first look at Q3 GDP, then Chicago PMI and Consumer sentiment. As for the FED. On monday FED chairman Bernanke gives a speech in Arlington, VA. at 8:30. The GDP report may be okay since there is little activity scheduled for the FED this week. Best to your week!
CHARTS: http://stockcharts.com/def/servlet/Favorites.CServlet?obj=ID1606987
http://caldaroew.spaces.live.com
After about 40 years of investing in the markets one learns that the markets are constantly changing, not only in price, but in what drives the markets. In the 1960s, the Nifty Fifty were the leaders of the stock market. In the 1970s, stock selection using Technical Analysis was important, as the market stayed with a trading range for the entire decade. In the 1980s, the market finally broke out of it doldrums, as the DOW broke through 1100 in 1982, and launched the greatest bull market on record.
Sharing is an important aspect of a life. Over 100 people have joined our group, from all walks of life, covering twenty three countries across the globe. It's been the most fun I have ever had in the market. Sharing uncommon knowledge, with investors. In hope of aiding them in finding their financial independence.
Copyright © 2010 Tony Caldaro - All Rights Reserved Disclaimer: The above is a matter of opinion provided for general information purposes only and is not intended as investment advice. Information and analysis above are derived from sources and utilising methods believed to be reliable, but we cannot accept responsibility for any losses you may incur as a result of this analysis. Individuals should consult with their personal financial advisors.
© 2005-2022 http://www.MarketOracle.co.uk - The Market Oracle is a FREE Daily Financial Markets Analysis & Forecasting online publication.