Most Popular
1. Banking Crisis is Stocks Bull Market Buying Opportunity - Nadeem_Walayat
2.The Crypto Signal for the Precious Metals Market - P_Radomski_CFA
3. One Possible Outcome to a New World Order - Raymond_Matison
4.Nvidia Blow Off Top - Flying High like the Phoenix too Close to the Sun - Nadeem_Walayat
5. Apple AAPL Stock Trend and Earnings Analysis - Nadeem_Walayat
6.AI, Stocks, and Gold Stocks – Connected After All - P_Radomski_CFA
7.Stock Market CHEAT SHEET - - Nadeem_Walayat
8.US Debt Ceiling Crisis Smoke and Mirrors Circus - Nadeem_Walayat
9.Silver Price May Explode - Avi_Gilburt
10.More US Banks Could Collapse -- A Lot More- EWI
Last 7 days
Stock Market Volatility (VIX) - 25th Mar 24
Stock Market Investor Sentiment - 25th Mar 24
The Federal Reserve Didn't Do Anything But It Had Plenty to Say - 25th Mar 24
Stock Market Breadth - 24th Mar 24
Stock Market Margin Debt Indicator - 24th Mar 24
It’s Easy to Scream Stocks Bubble! - 24th Mar 24
Stocks: What to Make of All This Insider Selling- 24th Mar 24
Money Supply Continues To Fall, Economy Worsens – Investors Don’t Care - 24th Mar 24
Get an Edge in the Crypto Market with Order Flow - 24th Mar 24
US Presidential Election Cycle and Recessions - 18th Mar 24
US Recession Already Happened in 2022! - 18th Mar 24
AI can now remember everything you say - 18th Mar 24
Bitcoin Crypto Mania 2024 - MicroStrategy MSTR Blow off Top! - 14th Mar 24
Bitcoin Gravy Train Trend Forecast 2024 - 11th Mar 24
Gold and the Long-Term Inflation Cycle - 11th Mar 24
Fed’s Next Intertest Rate Move might not align with popular consensus - 11th Mar 24
Two Reasons The Fed Manipulates Interest Rates - 11th Mar 24
US Dollar Trend 2024 - 9th Mar 2024
The Bond Trade and Interest Rates - 9th Mar 2024
Investors Don’t Believe the Gold Rally, Still Prefer General Stocks - 9th Mar 2024
Paper Gold Vs. Real Gold: It's Important to Know the Difference - 9th Mar 2024
Stocks: What This "Record Extreme" Indicator May Be Signaling - 9th Mar 2024
My 3 Favorite Trade Setups - Elliott Wave Course - 9th Mar 2024
Bitcoin Crypto Bubble Mania! - 4th Mar 2024
US Interest Rates - When WIll the Fed Pivot - 1st Mar 2024
S&P Stock Market Real Earnings Yield - 29th Feb 2024
US Unemployment is a Fake Statistic - 29th Feb 2024
U.S. financial market’s “Weimar phase” impact to your fiat and digital assets - 29th Feb 2024
What a Breakdown in Silver Mining Stocks! What an Opportunity! - 29th Feb 2024
Why AI will Soon become SA - Synthetic Intelligence - The Machine Learning Megatrend - 29th Feb 2024
Keep Calm and Carry on Buying Quantum AI Tech Stocks - 19th Feb 24

Market Oracle FREE Newsletter

How to Protect your Wealth by Investing in AI Tech Stocks

Four Financial Stock Charts to Watch

Stock-Markets / Company Chart Analysis Nov 03, 2010 - 01:35 PM GMT

By: Mike_Paulenoff

Stock-Markets

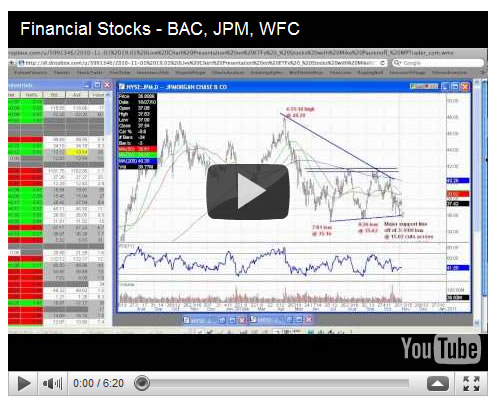
In our Webinar Monday evening, we reviewed the financial sector, a video clip of which is available in this Mid-Day Minute, and whose chart analysis is still very applicable today, ahead of the Fed announcement.


Starting with Bank of America (BAC), which has had a major correction already, my sense is that before it makes another downleg a rally is coming first. So if you think you want to be short BAC or long some inverted ETF, my sense is there'll be a higher price to do that. I think a rally can go close to 12.00. The larger picture is still in a massive downtrend, although if it's somehow able to chew through 13.00 and 14.00, then it will have broken out of that downtrend.

JP Morgan (JPM)'s chart doesn't do it for me on the long side. I understand that as long as it holds around 36, it's in okay condition, but the fact that it had a chance to break out and chew into resistance around 41-42 and failed suggests to me that this consolidation is going to fail. Maybe if BAC rallies to 12, JPM can attack the trendline again from the April high at around 39.30. But if it gets there, then I think it'll come back down and struggle to maintain support at around 35.62 to 35.16. If it breaks there it'll really have a problem.

Wells Fargo (WFC) looks a lot better than BAC and JPM, and has what can be considered a double low in the 23 1/4 to 22.90 area. But to get any traction it needs to take out resistance. If it closes above or accelerates through 26.50, then I think something positive is going on.

Citigroup (C) was my favorite and still has a pattern that looks good to me. From a weekly perspective, it has a series of lower highs and higher lows. If it can hurdle the 4.30-.32 area where it peaked last time, the next level would be the trendline at around 4.70. If it can somehow take out the trendline it would be very positive, with a target of close to 6.

Sign up for a free 15-day trial to Mike's ETF & Stock Trading Diary today.

By Mike Paulenoff

Mike Paulenoff is author of MPTrader.com (www.mptrader.com), a real-time diary of his technical analysis and trading alerts on ETFs covering metals, energy, equity indices, currencies, Treasuries, and specific industries and international regions.

© 2002-2010 MPTrader.com, an AdviceTrade publication.  All rights reserved. Any publication, distribution, retransmission or reproduction of information or data contained on this Web site without written consent from MPTrader is prohibited. See our disclaimer.

Mike Paulenoff Archive

© 2005-2022 http://www.MarketOracle.co.uk - The Market Oracle is a FREE Daily Financial Markets Analysis & Forecasting online publication.


Post Comment

Only logged in users are allowed to post comments. Register/ Log in