


Global Stock Markets Breakout on Fed QE2
Stock-Markets / Elliott Wave Theory Nov 06, 2010 - 01:35 PM GMTBy: Tony_Caldaro

 The stock markets, worldwide, broke out of their trading range this week after the FED announced their QE 0.6 ($trillion) program on wednesday afternoon. The Bank of Japan followed up by announcing they were going to buy Japanese equity ETF’s and other financial instruments as part of their central bank intervention program. On tuesday, the Liberterian wing of the Republican party gained enough seats to swing the House of Representatives to the GOP. We reported on this event on thursday:Politics and Secular Stocks Bull/Bear Markets, The Fourth Turning Crisis
On the economic front the week was more balanced than last but still positive. On the downtick were personal income/spending, PCE prices, pending home sales, weekly mortgage applications and the monetary base. Holding steady were the unemployment rate and the WLEI. On the uptick were the payroll/ADP employment reports, productivity, ISM manufacturing/services, construction spending, factory orders and auto sales. The equity market had its best week since the beginning of September. The SPX/DOW were +3.25% and the NDX/NAZ were +2.90%. Asian markets soared 5.1%, European markets gained 1.0%, the Commodity equity group added 2.0%, and the DJ World index was +3.6%. Bonds gained 0.9%, Crude rallied 6.8%, Gold was +2.6%, and the USD lost 0.6%. Next week will be highlighted by the Trade/Budget deficits and several speeches by FED governors. Best to your week!
LONG TERM: bull market
While the US equity market was in a trading range we reported, last weekend, about the cycles that impact the markets. The weekend before that about the global bull market. This weekend we get back to the technicals displayed in the US bull market. During the 2002-2007 bull market, OEW was in a long term uptrend and quantifying the impulse waves as the stock market moved higher. During this entire five year period the weekly MACD remained positive - above neutral, and the RSI was getting quite overbought during uptrends and barely oversold during downtrends.
When the bear market started from the October 2007 top, OEW signalled a long term downtrend in early January. As the waves started to unfold to the downside, quantified by OEW, the MACD and RSI reversed their patterns. The MACD went negative – dropped below neutral and stayed there. The RSI was now getting extremely oversold during downtrends, and only once did it reach a barely overbought condition. In early March 2009, around SPX 700, OEW displayed a completed zigzag pattern and we projected a rally into the SPX mid-1100′s area over the next several months.
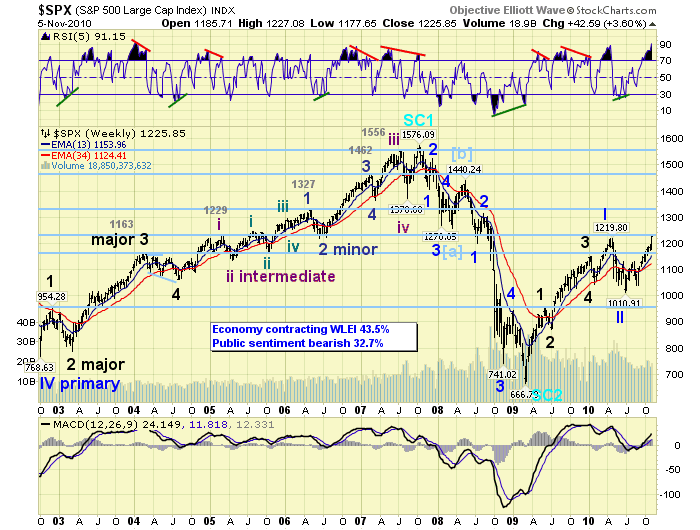
Since the March 2009 low, however, the market totally reversed its character. OEW had quantified three waves, and then signalled a delayed long term uptrend in early January 2010 just before the third wave was reaching the targeted SPX 1150 area. This created an inflection (decision) point for the stock market. Either break lower and continue the bear market, or hold ground and start uptrending higher. The SPX corrected into February and then started its fifth wave. The anticipated rally off the March 2009 low was now a bull market. Notice how the MACD moved above neutral and has stayed positive. Also observe how the RSI is again getting extremely overbought during uptrends, and barely oversold during downtrends.
The five waves up from the March 2009 low we labeled as the five Major waves of Primary wave I. The correction that followed into early July we labeled Primary wave II. The current uptrend is Major wave 1 of Primary wave III. This Primary wave should also contain five Major waves, just like Primary wave I. After that we should get Primary waves IV and V. When the market completes the fifth Primary wave the bull market should conclude. We had created a general guideline for the rest of the bull market:SPX Stocks Bull Market Projection
MEDIUM TERM: uptrend new high at SPX 1227
After the early July Primary wave II low at SPX 1011 we received several buy signals generated by the market. These buy signals are quite good at projecting OEW uptrend confirmations ahead of time. OEW did confirm the uptrend and the market rallied to SPX 1129 in early August. We labeled this wave Intermediate wave one of the uptrend Major wave 1. The market then corrected quite dramatically to SPX 1040 by the end of August, but remained in an OEW uptrend. We labeled this low Intermediate wave two of Major wave 1. Since that low the market has been rising in Intermediate wave three. Remember it takes five Intermediate waves to create a Major wave.
When this rally first began we projected that Intermediate wave three would likely have a fibonacci 1.618 relationship to Intermediate wave one. Since Int. one traveled 118 SPX points, (1011-1129), Int. three would reach that relationship around SPX 1231, [(118 x 1.618) + 1040]. With this level in between two OEW pivots, (1222 and 1240), we settled for the lower pivot at SPX 1222. The SPX hit 1227 this week! The minimum target has been achieved. In fact, for the past eight weeks the SPX has been making new uptrend highs every week.
Reviewing the technicals for this uptrend we observe an extremely overbought condition on the weekly RSI, while the MACD is rising. The daily charts, however, display extreme overbought conditions in both the RSI and MACD. This suggests the typical pullback for this uptrend, (13-26 points), can occur at any time. Overall, we’re expecting this uptrend to gradually work its way higher into January 2011, and reach the 1313 OEW pivot. The larger pullback of Intermediate wave four must occur before that target is reached.
SHORT TERM
Support for the SPX is at a new bull market high 1222 and then 1187, with resistance at 1240 and then 1261. Short term momentum is extremely overbought and started to weaken on friday. We spent some time examining the short term OEW charts. We have had several weeks of choppy market action which was finally cleared this week. After a complete review we arrived at the decision that Intermediate wave three is extending. We first noticed this potential on friday and posted a tentative count on the daily NDX. We noted this count update in the comment section: http://stockcharts.com/h-sc/...
We have since upgraded the hourly SPX/DOW charts to display a more detailed count. Minor waves 1 and 2, plus Minute waves one and two remain as originally posted. Minute wave three has been moved to SPX 1186, and Minute wave four appears to have taken the shape of a fourth wave triangle ending at SPX 1178 in early Novmember. This would explain the choppy action over the past several weeks and it displays alternation between Minute waves 2 and 4. This count suggests that Minor wave 3 may be completing now, with Minor wave 4 and 5 to follow to complete Intermediate wave three. With today’s close above the OEW 1222 pivot the market can now set its sights on the OEW 1240 pivot for Int. wave three.
When we first projected that this uptrend was going to be about six months in duration we knew it was not going to be that easy to track. So far it has been less difficult than it could have been. Best to your trading!
FOREIGN MARKETS
Asian markets soared this week +5.1%. The leader was Hong Kong’s HSI +7.7% and the lagger Australia’s ASX +3.0%. All but one remain in confirmed uptrends. Japan’s NIKK is close to confirming an uptrend.
European markets rose 1.0% on the week. England’s FTSE led +3.5% and Spain’s IBEX lagged -3.6%. All remain in uptrends, but the IBEX is certainly under selling pressure.
The Commodity Equity group gained 2.0% this week. All remain in uptrends.
The DJ World index gained 3.6% on the week and remains in an uptrend.
COMMODITIES
Bond prices rebounded this week to gain 0.9%. Bond yields, however, are still above the recent 2.33% yield low and look like they are trying to confirm an uptrend.
Crude soared 6.8% on the week as its uptrend continues. It hit a new 2 year high on friday at $87.58.
Gold gained 2.6% on the week to a record high of $1,398/oz. It is now within our initial uptrend target of $1389-$1411. Possibly a small pullback and then another new high.
The downtrending USD had a volatile week losing 0.6%. It’s quite oversold medium term and has another positive divergence short term. Uptrend possibilities again. The Euro (+0.8%) displays an inverse scenario.
NEXT WEEK
Tuesday kicks of the economic week with Wholesale inventories. On wednesday; weekly Jobless claims, the Trade/Budget deficits and Export/Import prices. Then on friday the UofM Consumer sentiment reading. As for the FED. On monday, FED governor Warsh gives a speech at 3:30 in NYC. Then on friday FED governor Tarullo gives a speech in Wash, DC., and FED governor Raskin gives a speech in Boston, MA. Best to your week!
CHARTS: http://stockcharts.com/def/servlet/Favorites.CServlet?obj=ID1606987
http://caldaroew.spaces.live.com
After about 40 years of investing in the markets one learns that the markets are constantly changing, not only in price, but in what drives the markets. In the 1960s, the Nifty Fifty were the leaders of the stock market. In the 1970s, stock selection using Technical Analysis was important, as the market stayed with a trading range for the entire decade. In the 1980s, the market finally broke out of it doldrums, as the DOW broke through 1100 in 1982, and launched the greatest bull market on record.
Sharing is an important aspect of a life. Over 100 people have joined our group, from all walks of life, covering twenty three countries across the globe. It's been the most fun I have ever had in the market. Sharing uncommon knowledge, with investors. In hope of aiding them in finding their financial independence.
Copyright © 2010 Tony Caldaro - All Rights Reserved Disclaimer: The above is a matter of opinion provided for general information purposes only and is not intended as investment advice. Information and analysis above are derived from sources and utilising methods believed to be reliable, but we cannot accept responsibility for any losses you may incur as a result of this analysis. Individuals should consult with their personal financial advisors.
© 2005-2022 http://www.MarketOracle.co.uk - The Market Oracle is a FREE Daily Financial Markets Analysis & Forecasting online publication.