


Stock Market Hits Important 61.8% Fibonacci Resistance Level
Stock-Markets / Stock Markets 2010 Nov 08, 2010 - 12:19 PM GMTBy: Marty_Chenard

For Fibonacci followers, the S&P 500 is a smidgen away from a momentous event.
What is the event?
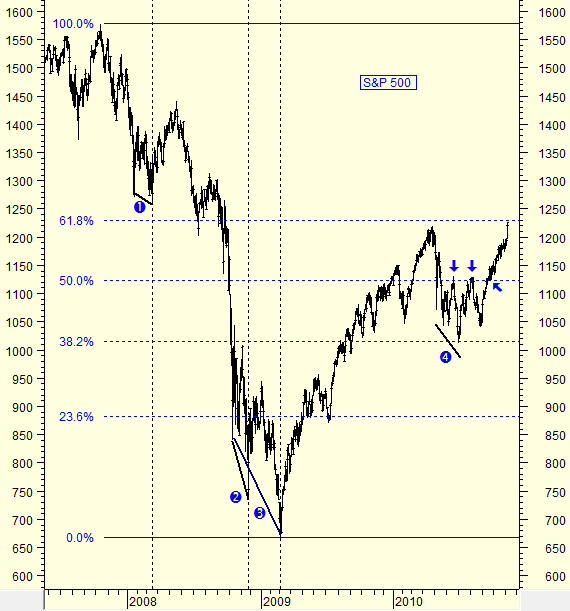
The event is that the S&P 500 is VERY close to reaching and testing its Fibonacci 61.8% level.
On today's chart, take a look at this year's action around the 50% and 38.2% levels and you will see why many investors pay attention to Fibonacci numbers.
In June and August, the S&P tested the Fibonacci 50% levels and pulled back. It wasn't until its 3rd. attempt in September, that it finally made it above the 50% Fibonacci level.
Also note how the S&P 500 failed to the downside in April, and then kept falling until July 1st.
What was significant about July 1st.?
A quick look at the chart gives you the answer ... on July 1st, the S&P 500 hit and tested its 38.2% Fibonacci support level ... where it held that day and ended up higher at the close. It moved up from there to ... you guessed it ... the 50% Fibonacci level.
** Feel free to share this page with others by using the "Send this Page to a Friend" link below.
By Marty Chenard
http://www.stocktiming.com/
Please Note: We do not issue Buy or Sell timing recommendations on these Free daily update pages . I hope you understand, that in fairness, our Buy/Sell recommendations and advanced market Models are only available to our paid subscribers on a password required basis. Membership information
Marty Chenard is the Author and Teacher of two Seminar Courses on "Advanced Technical Analysis Investing", Mr. Chenard has been investing for over 30 years. In 2001 when the NASDAQ dropped 24.5%, his personal investment performance for the year was a gain of 57.428%. He is an Advanced Stock Market Technical Analyst that has developed his own proprietary analytical tools. As a result, he was out of the market two weeks before the 1987 Crash in the most recent Bear Market he faxed his Members in March 2000 telling them all to SELL. He is an advanced technical analyst and not an investment advisor, nor a securities broker.
Marty Chenard Archive |
© 2005-2022 http://www.MarketOracle.co.uk - The Market Oracle is a FREE Daily Financial Markets Analysis & Forecasting online publication.