


Crude Oil and Natural Gas Energy Markets Elliott Wave Analysis
Commodities / Crude Oil Nov 09, 2010 - 04:42 AM GMTBy: Tony_Caldaro

 In recent months we have observed commodities rising in anticipation of another FED quantitative easing program. Then, last week, the FED officially announced the QE 0.6 ($trillion) program and commodities took off again. The commodity bull market continues.
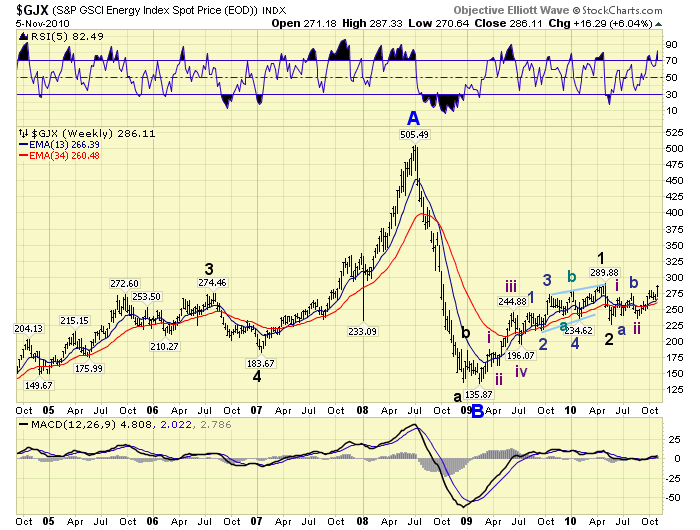
Last week we watched Crude oil hit a two year high, along with Agriculture and Basic Metals, and Gold hit another all time high. When we track commodities we use the five sectors provided by the Goldman Sachs Commodity Index: energy, precious metals, agricultural, basic metals and livestock. The energy sector is our focus today. The GJX is composed of W. Texas Crude, Brent Crude, Heating Oil, Gas Oil, RBOB Gasoline and Natural Gas. We chart the GJX index, W. Texas Crude and Natural Gas. As you can observe, in the chart below, GJX is in a long term uptrend.
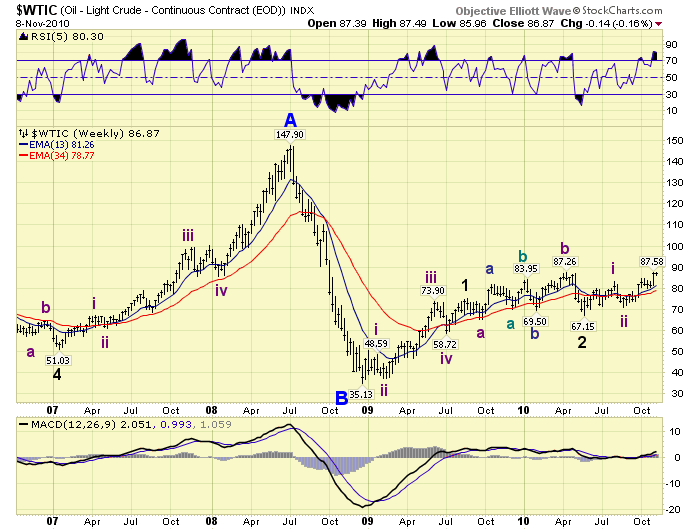
Also Crude oil is in a long term uptrend.
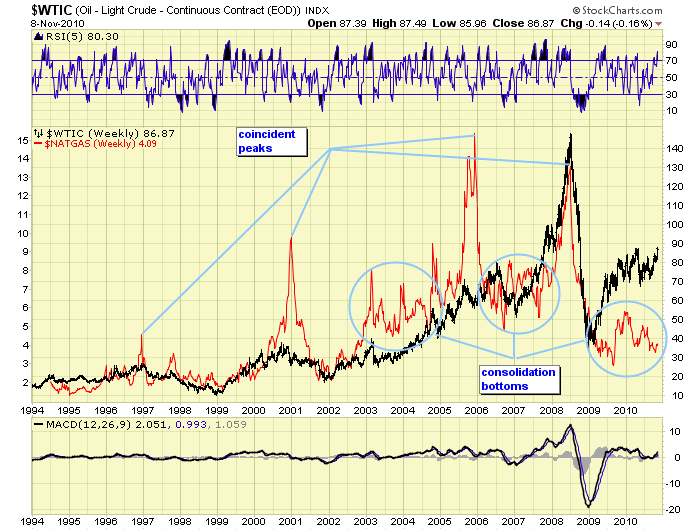
Historically, Crude and Natural Gas track each other fairly well and have had several coincident peaks: 1997, 2001, 2005/6 and 2008. This is illustrated in the chart below. Also note, in recent years NatGas has gone through periods of creating consolidating bottoms before it joins Crude in its advance. This is probably a result of the NatGas supply factor.
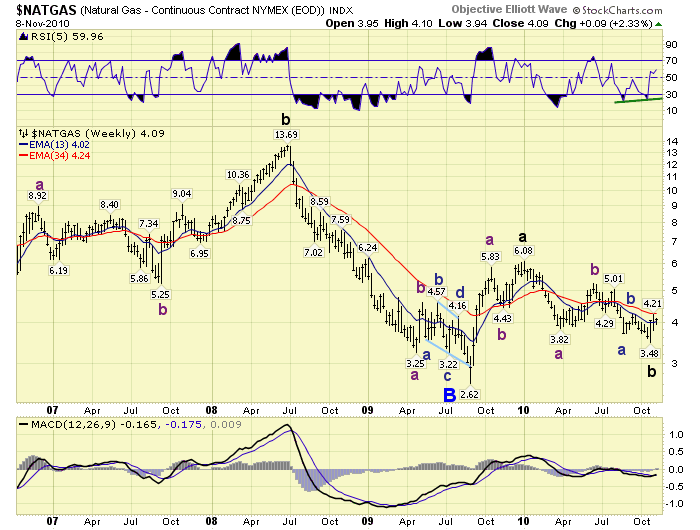
In September 2009 we identified the low in NatGas around $2.62. This was followed by a sharp rally to $6.08 by January 2010. After that this commodity corrected for several months, right into its seasonal low price period: September/October. The green arrows on the chart below display this seasonal pattern, and we have added the long term OEW count.
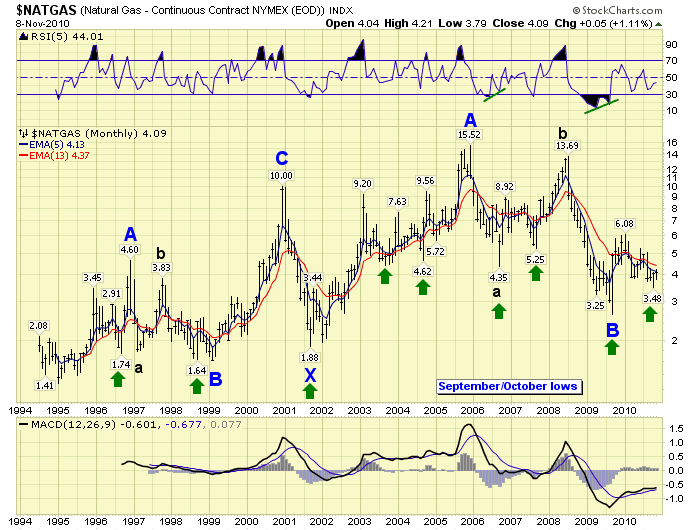
Taking a look at the weekly chart of the past few years. We observe the Major B wave high at $13.69 in 2008, and then the collapse to $2.62, completing the Primary B wave in 2009. NatGas then started a rising Primary C wave with the first uptrend off that low. After an initial spurt to $6.08 it has spent most of 2010 in the consolidation base building process. The recent low at $3.48 may have ended it. With Crude making new two year highs recently NatGas looks ready to start moving higher as well. In fact, it just confirmed a medium term uptrend. Should NG continue its pattern we could see $13.00-$15.00 levels in the next couple of years.
Best to your trading!
http://caldaroew.spaces.live.com
After about 40 years of investing in the markets one learns that the markets are constantly changing, not only in price, but in what drives the markets. In the 1960s, the Nifty Fifty were the leaders of the stock market. In the 1970s, stock selection using Technical Analysis was important, as the market stayed with a trading range for the entire decade. In the 1980s, the market finally broke out of it doldrums, as the DOW broke through 1100 in 1982, and launched the greatest bull market on record.
Sharing is an important aspect of a life. Over 100 people have joined our group, from all walks of life, covering twenty three countries across the globe. It's been the most fun I have ever had in the market. Sharing uncommon knowledge, with investors. In hope of aiding them in finding their financial independence.
Copyright © 2010 Tony Caldaro - All Rights Reserved Disclaimer: The above is a matter of opinion provided for general information purposes only and is not intended as investment advice. Information and analysis above are derived from sources and utilising methods believed to be reliable, but we cannot accept responsibility for any losses you may incur as a result of this analysis. Individuals should consult with their personal financial advisors.
© 2005-2022 http://www.MarketOracle.co.uk - The Market Oracle is a FREE Daily Financial Markets Analysis & Forecasting online publication.
Comments
|
juan
13 Sep 11, 19:32 |
nat gas
Any new updates on the wave count.......been very patient on natty! Lol |