


Should One Invest Now Invest in the U.S. or China’s Stock Market?
Stock-Markets / Chinese Stock Market Nov 09, 2010 - 05:12 AM GMTBy: Lorimer_Wilson

 Nu Yu writes: Where should one invest these days for the greatest projected returns? I do weekly analyses of both the American and Chinese stock markets and have identified specific developments that point the way short- and mid-term and suggest a future scenario for one of them. Let me explain:
American Stocks Still Bullish but Showing Signs of Weakness
The Dow Jones Wilshire 5000 index, as a benchmark of the total U.S. equity market, continued its rally this past week with a boost resulting from the midterm elections and the Fed's QE2 decision.
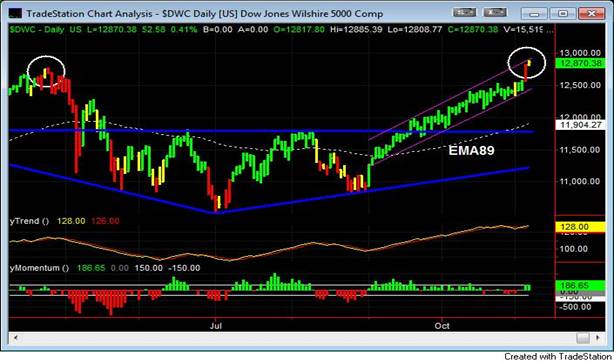
1. The Leading Wave Index (LWX) indicator, color coded in the price bars of the following daily chart of the Wilshire 5000 index, turned off the bullish time-window on Thursday with a registered negative value of the LWX. Based on the forecast of the LWX indicator, the market could be entering the bearish time-window which looks similar to what it acted in the late of April (see the white circles marked on the chart).
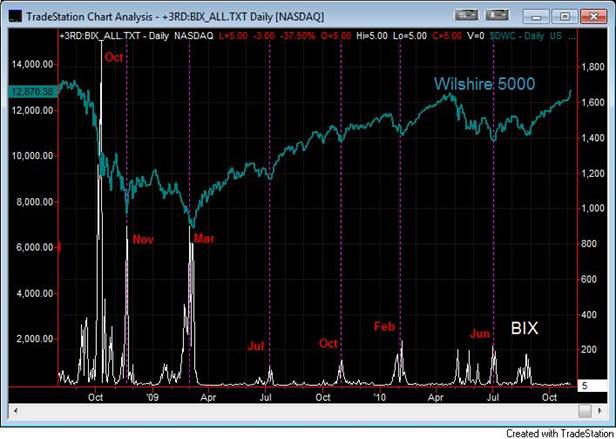
2. The Broad Market Volatility (BIX) index, measured from over 8000 U.S. stocks, closed at 5 on Friday and remains well below the panic threshold level of 46 indicating that the current market is still bullish. The BIX is plotted in the following chart as compared with the Wilshire 5000 index.
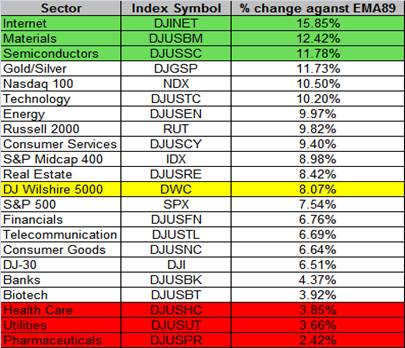
3. Sector and Index Percentage Changes as indicated in the following table show the Dow Jones Wilshire 5000 up 8.07% more than the 89-day exponential moving average (EMA89). The out-performing sectors include the Internet (+15.85%), Materials (+12.42%), and Semiconductor (+11.78%) while under-performing sectors include Pharmaceuticals (+2.42%), Utilities (+3.66%), and Healthcare (+3.85%). The NASDAQ 100 (+10.50%) is outperforming the market, and the DJ-30 (+6.51%) is underperforming.
Chinese Stocks to Remain Extremely Bullish For the Next 6-8 Months
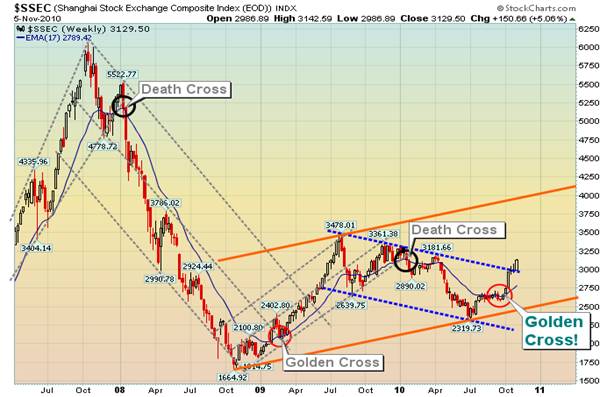
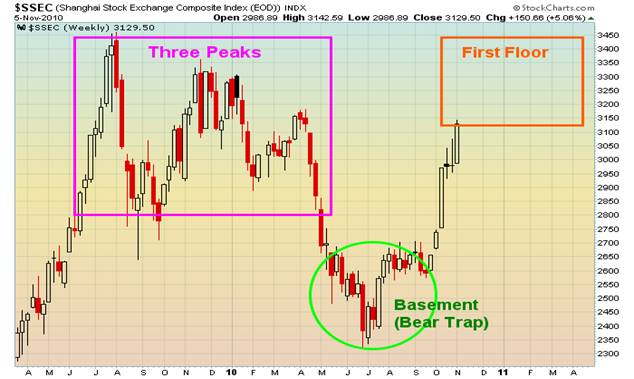
As shown in the following weekly chart the Shanghai Stock Exchange Composite (SSEC) Index broke through resistance at 3000 and kept advancing indicating that the Chinese stock market is out of the bearish shadow of its 14-month downtrend channel (the dotted blue lines), and is forming a potential uptrend channel (the orange lines). The upper boundary of the potential uptrend channel projects the price target for the SSEC at around 4200 by the middle of 2011 i.e. +35% from the current level.
SSEC Index Continues to Track the "Three Peaks and Domed House" Pattern
A special chart pattern, "Three Peaks and Domed House", has been developing from China's Shanghai Stock Exchange Composite Index. With my modified version of George Lindsay's basic model (see below), the "Three Peaks and Domed House" pattern can be divided into five major phases: 1) Three Peaks phase, 2) Basement phase, 3) First Floor phase, 4) Roof phase, and 5) Plunge phase.
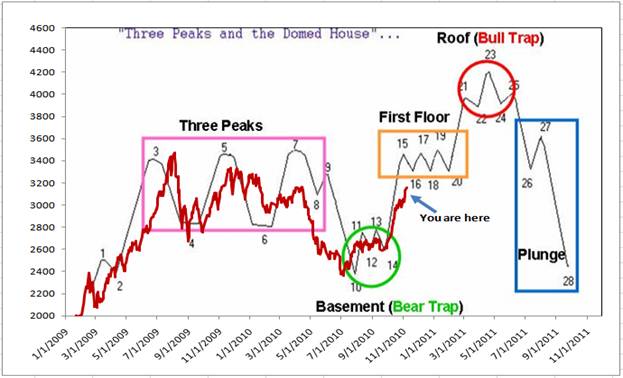
The above modified version, using “phase-counting”, is a macro approach to Lindsay’s basic model, and it is different from the classical micro approach using “number-counting” from 1 to 28. In the chart above the SSEC is plotted as a red line against Lindsay’s idealized model in a black line.
From June of 2009 to April of 2010, the Shanghai index developed the “Three Peaks” phase (the pink rectangular). Then it had a sharp separating decline to reach the July 2010 low at 2320 and formed the “Basement” phase (the green circle) during this summer. It is currently rising towards the “First Floor” phase (the orange rectangular) in the chart below.
Calibrated against Lindsay’s model the SSEC should reach:
a) the “First Floor” phase near 3300 (i.e. +5% from current level) by the end of 2010
b) the “Roof” phase of the Domed House at or near 4200 (i.e. +40% from current level) by the middle of 2011.
Conclusion
The above analyses indicates that both the American and Chinese stock markets are both stable and sound at the present time with the Chinese SSEC having substantial upside potential before plunging off the “Roof” of the “Domed House” back into the “Basement” below.
The American and Chinese stock markets will continue to outperform gold in the near term
Please Note: Don't forget to sign up for munKNEE’s FREE weekly "Top 100 Stock Market, Asset Ratio & Economic Indicators in Review"
Dr. Nu Yu (fx5186.wordpress.com/), co-founder and president of Numarkan Investments and an affiliate of the Market Technician Association, is a frequent contributor to www.munKNEE.com
Visit http://www.FinancialArticleSummariesToday.com, “A site/sight for sore eyes and inquisitive minds”, and www.munKNEE.com, “It’s all about MONEY”, where you can sign up for their FREE weekly "Top 100 Stock Market, Asset Ratio & Economic Indicators in Review."
© 2010 Copyright Dr. Nu Yu - All Rights Reserved
Disclaimer: The above is a matter of opinion provided for general information purposes only and is not intended as investment advice. Information and analysis above are derived from sources and utilising methods believed to be reliable, but we cannot accept responsibility for any losses you may incur as a result of this analysis. Individuals should consult with their personal financial advisors.
© 2005-2022 http://www.MarketOracle.co.uk - The Market Oracle is a FREE Daily Financial Markets Analysis & Forecasting online publication.