


Stock Market Strength, Optimism Continues Into Year-end
Stock-Markets / Stock Markets 2010 Nov 12, 2010 - 03:54 AM GMTBy: Donald_W_Dony

Global stock markets have surged since the corrective low in early September. Many world equity indexes have pegged double digit returns in less than 10 weeks. The two most watched indexes, the S&P 500 and the Dow Jones Industrial Average, have also kept pace with the global advance by leaping 15.4% and 12.5% respectively. Yet this positive performance has many investors worried. With conflicting economic data plus generally upbeat Q3 earnings, can the markets continue their climb?
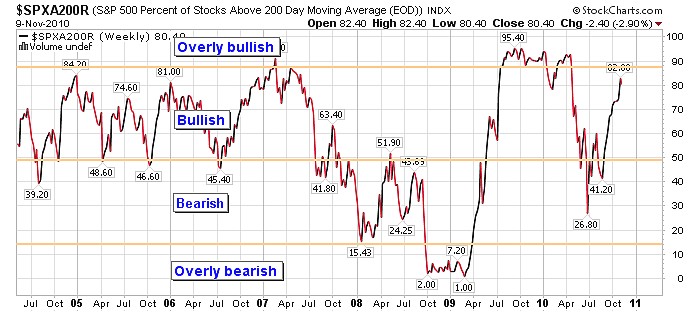
A reliable gauge of underlying strength often comes from the percentage of advancing stocks within an index (Chart 1). Levels that are over 50% are normally associated with positive performing markets. Percentages below 50% suggest the index is in transition or worst, starting to decline. The current reading of the percentage of advancing stocks on the S&P 500 is a bullish 80.40% and still rising. At this range, any market correction is short-lived and shallow.
As the economic health of a nation and its stock market performance are closely tied together, a measurement of the key components of the economy can provide valuable information for investors. One of those key measurements comes from the consumer. The spending direction of this largest contributing element of the economy can offer insights into how optimistic or pessimistic they have become. When consumers are generally feeling positive about their finances, they are more likely to spend on items that they do not particularly need (consumer discretionaries). When the consumer is concerned about the future, there is normally a heightened focus on purchasing only the basics (consumer staples).
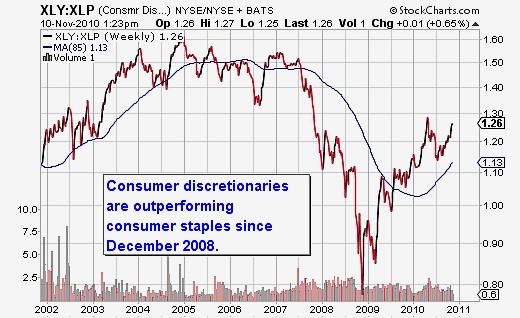
Chart 2 is a ratio gauge of the performance between these two industry groups. During the bear market (2007-2008), the line has trended down. This means that the Consumer Staples index (XLP) was outperforming the Consumer Discretionary Index (XLY). Since late 2008, the line has been steadily advancing. This indicates that XLY is outperforming XLP and that consumers, are once again, feeling increasingly positive about their financial position.
Bottom line: Stock market strength and consumer optimism continues to ride a upward wave into year-end. Presently, 80% of the equities on the broad-based S&P 500 are trading above their long-term 200 day moving average. This fact coupled with the positive economic element of consumer spending on discretionaries over defensive staples indicates a high probability of higher stock market levels by January.
Investment approach: As stock markets generally trade in about 4-month cycles, models indicate that the next low can be expected in late December. This trough will likely be minor as 4th quarters in a mid-term election year plus the normal year-end holiday strength should provide good underlying support. Investors may wish to take advantage of this anticipated pullback to add to existing positions or look for new opportunities.
Longer-term, Q1 represents the start of the third year of the bull market. As stock markets, on average, are approximately four years in duration, investors should understand that there is probably another 18 to 24 months of growth still to come.
Your comments are always welcomed.
By Donald W. Dony, FCSI, MFTA
www.technicalspeculator.com
COPYRIGHT © 2010 Donald W. Dony
Donald W. Dony, FCSI, MFTA has been in the investment profession for over 20 years, first as a stock broker in the mid 1980's and then as the principal of D. W. Dony and Associates Inc., a financial consulting firm to present. He is the editor and publisher of the Technical Speculator, a monthly international investment newsletter, which specializes in major world equity markets, currencies, bonds and interest rates as well as the precious metals markets.
Donald is also an instructor for the Canadian Securities Institute (CSI). He is often called upon to design technical analysis training programs and to provide teaching to industry professionals on technical analysis at many of Canada's leading brokerage firms. He is a respected specialist in the area of intermarket and cycle analysis and a frequent speaker at investment conferences.
Mr. Dony is a member of the Canadian Society of Technical Analysts (CSTA) and the International Federation of Technical Analysts (IFTA).
Donald W. Dony Archive |
© 2005-2022 http://www.MarketOracle.co.uk - The Market Oracle is a FREE Daily Financial Markets Analysis & Forecasting online publication.