The Greatest Stocks Bull Market in History - Chinese Shanghai Red-chips
Stock-Markets / Chinese Stock Market Oct 12, 2007 - 06:55 AM GMTBy: Gary_Dorsch

 “There is a bubble growing. Investors should be concerned about the risks,” warned Cheng Siwei, the vice-chairman of the National People's Congress in an interview with the Financial Times on January 31st. “But in a bull market, people will invest relatively irrationally. Every investor thinks they can win. But many will end up losing. But that is their risk and their choice,” warned Cheng.
Cheng's attempt to talk down the high flying Shanghai red-chip market in late January, by planting fear and doubt into traders' minds, suggested that Beijing would take official action to cool speculation in the booming market, after reaching the 3,000 level, and tripling from 1,060 a year earlier. In a knee-jerk reaction to Cheng's remarks, the Shanghai red-chip index tumbled 500-points to the 2,500 level, before it stabilized, and would then begin one of the greatest bull markets in history.
Last night, the Shanghai red-chip market hit a new all-time high of 5,913, up 118% so far this year, and up 55% from just three months ago. Shanghai red-chips have doubled since Cheng tried to put a lid on the market. Shanghai is arguably one of the greatest bull markets in history, and by most accounts, appears to be driven by China's booming exports and trade surpluses, which are hauling in large amounts of money from overseas into the world's fourth largest economy.
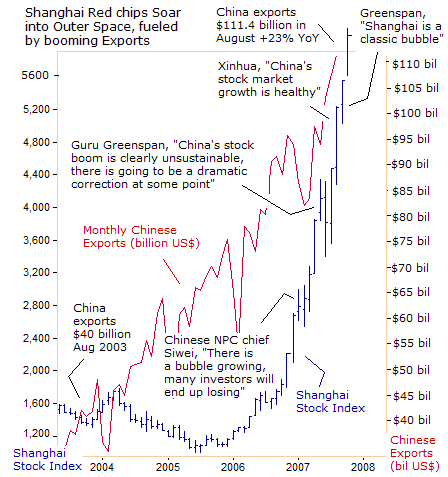
China posted a trade surplus of $25 billion in August, up from $18.8 billion a year earlier, fueled by exports, which grew 22.7%, with imports up 20.1%. The trade surplus hit a record high of $26.9 billion in June. For the first eight months of 2007, the surplus came to $161.7 billion. Foreign direct investment (FDI) was $41.9 billion. The rolling 12-month surplus rose to a whopping $245 billion.
The Peoples' Bank of China (PBoC) prints massive amounts of yuan each day, in exchange for the foreign currency flowing into the country. As a result, China's M2 supply is 18% higher from a year ago. China's bulging trade surplus has swelled the country's foreign exchange reserves to $1.4 trillion, although a “small sum of hot money also sneaks into the financial system through various means,” the official Shanghai Securities News reported on Sept 30th.
Beijing's “strict capital controls have played a key role in stemming an otherwise unimaginable amount of capital inflow to the country,” said Wang Guogang, vice-director of China's Financial Institute. “It is very improper to calculate the amount of hot money flowing into China by simply subtracting Chinese foreign exchange reserves from the sum of the trade surplus and FDI in the country,” he said.
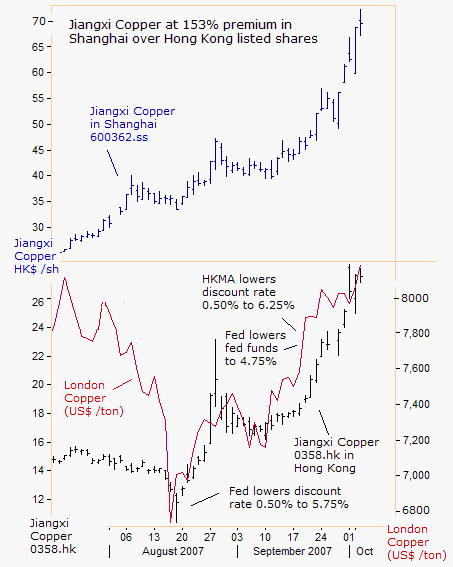
If such formula were to be used, there would be over $120 billion of hot money that has entered China so far this year, equivalent to 45% of the rise in the central bank's foreign exchange reserves in the first half of 2007. Hot money flows might be inflating Shanghai red-chips to huge premiums over their dually listed shares in Hong Kong. For instance, Jiangxi Copper, China's top integrated copper producer, is dually listed in Hong Kong, under symbol 0358.hk and in Shanghai under 600362.ss.
Yet Jiangxi Copper trades at a 153% premium in Shanghai over the company's listed shares in Hong Kong. When Jiangxi Copper shares are converted from yuan terms into HK$ terms, it's trading at HK$69.50 in Shanghai, far above the HK$27.50 /share price in Hong Kong. Strict capital control between the two Chinese currencies prevents arbitrage and exchanging of shares between the two stock markets.
The market craze in Shanghai, catapulted Shenhua Energy 601088.SS, 1088.HK, sharply higher last week, surging 87% in its Shanghai IPO listing, and climbing a further 10% to 76.23 yuan /share the next day. The price-earnings ratio for all Shanghai-listed stocks is roughly 43, which is very high by international standards.
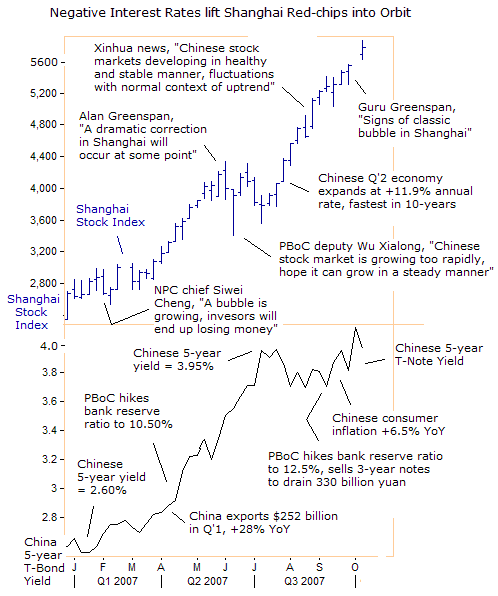
To curb excess liquidity, China raised bank reserve requirement ratios by 3.5% to 12.5% so far this year, and plans to issue 800 billion yuan of special treasury bonds to soak up (sterilize) some of the yuan that it has printed this year. China raised the one-year deposit by 0.81% to 3.87% this year, and reduced the withholding tax on interest income to 5% from 20% as of August 15.
But the yield on China's 5-year T-note stopped climbing since early July, and is stuck at 3.95% today, or roughly 2.5% below China's consumer price inflation (CPI) rate, yielding a huge negative rate of return, when adjusted for inflation. Since the PBoC prints more yuan than it soaks up, the money supply is still growing rapidly at 18%, and when Chinese investors are offered negative interest rates of 2.5%, the only alternative is to buy red-chips and gold.
Once the yield on China's 5-year T-note peaked at 3.95% in July, the Shanghai red-chip market became unleashed and soared 54% over the next three months. The powerful rise of Shanghai Red-chips was in defiance of predictions by former Federal Reserve chief “Easy” Al Greenspan, who said on May 23rd, that the boom in Chinese stocks could not last, soon after Shanghai red-chip index approached 4,000. “It is clearly unsustainable. There's going to be a dramatic contraction at some point,” Greenspan declared. But three months later, Shanghai rallied to 5,913.
“If you ever want to get a definition of a bubble in the works, that's it,” Greenspan told reporters in London on October 1st, referring to the Shanghai market at 5,200. And who knows more about blowing bubbles into asset markets, than “Easy” Al, a serial bubble blower at the Fed. But Shanghai traders aren't willing to call an end to the uptrend just yet, although profit-taking is expected near the 6,000 level.
Gold Glitters in China in the “Year of the Pig,”
With Shanghai red-chips becoming increasingly expensive, a major shift into gold is already underway, with the yellow metal jumping by 10% to 5,550-yuan /ounce, since mid-August. Jewelry demand for gold is expected to be exceptionally strong this lunar year of the “Golden Pig” which only falls every 60 years.
The World Gold Council showed China had overtaken Turkey as the world's third-largest gold consumer in 2005. India is the world's top consumer and the United States the second. Mainland gold demand rose 32% to 76 tons in the three months ending June. And gold jewelry demand rose 30% in this period to 70.6 tons, as the demand of gold investment rose 76% by adding 5.3 tons on China's mainland.
Soaring stock and property prices boosted the wealth among China's super-rich. The number of Chinese worth $1 billion or more jumped to 108, from 15 last year. With growing affluence in China, gold consumption is expected to rise this year, helped by Beijing's measures to open up the bullion market and by new bank products that offer gold as an investment for depositors.
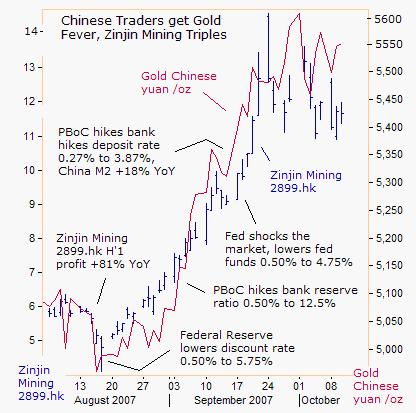
China's #1 gold miner Zijin Mining 2899.HK saw its share price more than double over the past six weeks in Hong Kong, after announcing plans on August 15th, to raise its gold production by 30.2%, copper production by 21.7% and zinc by 25.4% in the second half of this year from the first half. Zijin Mining's net profit soared 81% to 1.2 billion yuan ($158.2 million) in the first half of this year.
Zinjin Mining is benefiting from Shanghai's elevated level, and from a scarcity of gold equity. China's top four gold miners include Shandong Zhaojin, Shandong Jinchuang, Zijin Mining and Lingbao Gold, with annual output of roughly 5-6 tons. Of the more than 200 gold miners in China, only 36 had an annual output of more than 1 ton.
China is already the world's third largest gold producer, selling 122 tons in the first half of 2007. However, China's output is likely to get bigger, after the discovery of three major gold mines this year. A gold deposit holding 80 tons of proven gold reserves was found in the Shaanxi province, and the Yangshan Gold Mine, which has 162 tons of gold reserves were found and ranks sixth in the world. Another mine with more than 50 tons of gold reserves was found in Gansu.
China's Secret formula for Success – a cheap Yuan
Ultimately, the key to China's success as a major economic powerhouse, is it cheap yuan policy, pegging its currency at roughly 30% below its trade weighted value. The cheap yuan policy will enable China to overtake the United States and become the world's second largest exporter this year. In 2006, China's export volume trailed that of the US only by $70 billion, while its export growth speed was 7% higher.
Calculated at the current growth rate, China's exports may exceed US exports by $50 billion this year. If China maintains its foreign trade growth rate, it will replace Germany to become the world's top exporter in 2008.
The yuan has only appreciated by 9% against the US dollar over the last two years under a crawling peg, which has failed to halt the rise of China's trade surplus, and foreign currency reserves, which soared by $1 trillion from four years ago to a record $1.4 trillion in July. However, Beijing plowed as much as $900 billion of its FX reserves into US bonds, which depreciate in value, whenever the PBoC allows the dollar to slip against the yuan
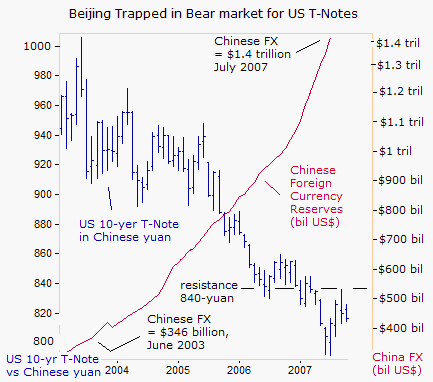
China owns $405 billion, or 18% of foreign-held US Treasuries, the second-biggest stash after Japan's $610 billion. And since June 2003, the US Treasury's 10-year Note has lost 16% in Chinese yuan terms. That's a big reason why Beijing fights so hard to fend off pressure for a revaluation of its currency. On the other hand, the US Treasury calculates that China's mammoth investment in US bonds, has probably depressed long-term yields by roughly 1% to 1.5%, and is preventing a much deeper recession in the US housing sector.
But the US Congress is threatening to enact “veto proof” protectionist legislation against China, due to the alarming trade gap between the two countries, which rose to $23.8 billion in July, or 21.6% higher than a year earlier. Canada bought $18.8 billion of US-made goods in July, but China, despite its massive size and rapid growth, bought only $4.8 billion of US goods. The US trade gap with China now accounts for 40% of the overall US trade gap, up from 29% a year ago.
With the US Congress aiming for a bill to pressure China to raise the value of the yuan, Beijing became a net seller of $12 billion of US T-bonds over the past four months. Beijing also began a $205 billion sovereign wealth fund on Sept 28th, to set up investments into other currencies such as the Euro and Australian dollar, and to stockpile industrial commodities needed to fuel its juggernaut economy.
Booming Chinese Economy supports Base Metals
While the US economy is hobbled by a weakening housing sector, China and India have emerged as the world's two biggest economic locomotives, and are increasing the focus of traders in base metals and miner shares. While the United States still accounts for 28% of global GDP, it's expected to account for only 9% of the world's economic growth in 2007, compared with China's 33% and India's 12 percent.
Xstrata Copper XTA.L, one of the world's largest copper miners, said on October 11th, it was concerned about demand in a slowing US economy, due to a weaker housing sector, but also saw phenomenal growth in India and China. China imported 3-million tons of scrap copper in the first seven months of 2007, up 18% from a year ago, keeping copper prices elevated near record highs
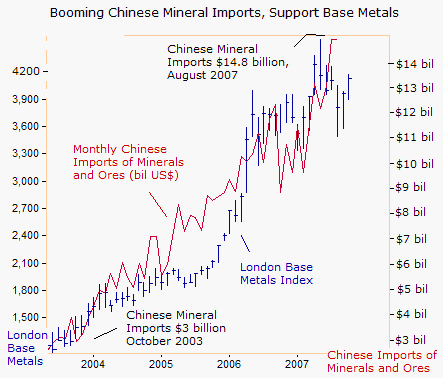
China's steel mills are key importers of minerals and ores, importing a record high of $14.8 billion in August, up from $3 billion 4-years ago. On October 8th, the International Iron and Steel Institute predicted that global steel demand will increase by 6.8% to 1.2 billion tons, outpacing the rate of global economic growth and bolstering mining companies that extract the various minerals and ores that go into the steel making process. Brazil, Russia, India, China, and Korea (BRICK) accounted for about 47% of global steel output in 2006, expanding output 13% in 2007.
Much like the Shanghai red-chip market, Korea's Kospi Index has soared into the stratosphere along a steep upward trajectory, climbing above the psychological 2000-level, and is up 44% so far this year. (analysis of Korean Kospi and Korean I-share EWY, presented in Oct 12th edition of Global Money Trends), Posco Steel 005490.ks, PKX.N, the world's third-largest steel maker, has been a market leader, climbing to $190 /share today from $80 /share at the start of the year. PKX.N raised prices of stainless steel five times this year, after seven hikes in 2006.
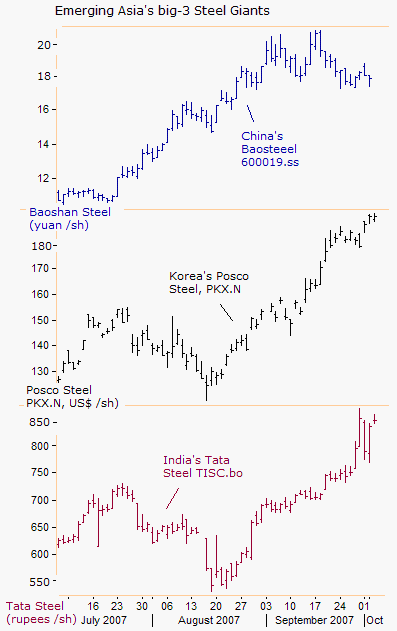
The steel industry is cyclical in nature and can tell us something about the health of the global economy. Global steel output for the first eight months of this year rose 7.6% to 871 million tons. However, excluding China, the year to date increase was up just 2.5%. Brazilian steel output was up 10.6% to 22 million tons. South Korean output was up 6.1% to 34 million tons, but India's fell 3.1% to 31.5 million tons in the first eight months of 2007.
Global Shipping Rates Skyrocket above 10,000
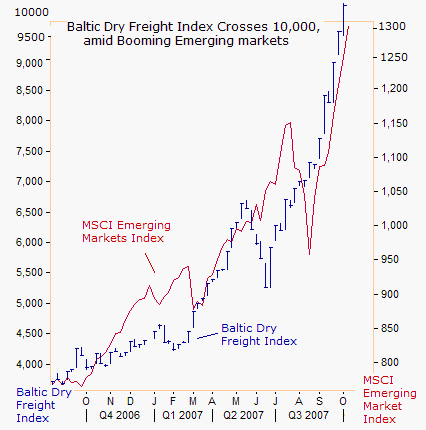
The Baltic Dry Index is also a good leading indicator for global economic growth and production. It measures the cost to book various cargoes of raw materials on various routes, such as 150,000 tons of iron ore going from Brazil to China or 150,000 tons of coal from Australia to Japan. And unlike stock and bond markets, the BDI is totally devoid of speculative fluff. Yesterday, the BDI closed above the once un-imaginable 10,000 level, more than triple its price from 20-months ago.
Thus, it's not just the price of gold and commodities and that soaring to multi-decade highs these days, it's also the cost of shipping dry goods across the world that is exploding, and ultimately, could touch off a round of hyper inflation around the globe. The latest surge in the BDI was triggered by the Federal Reserve's decision to lower its discount rate in August and weaken the US dollar.
But Fed officials hear no evil and see no evil, engaging in intellectual dishonesty and brainwashing to cover up an inflationary monetary policy. San Francisco Fed chief Janet Yellen told reporters on Oct 9th that the weak US dollar has had a surprisingly small impact on US import prices and would probably continue to do so as long as inflation expectations remain well anchored. “Inflation is closer to where we would like it to be and could edge down more over the next few years,” she said.
“The depreciation of the dollar is something that we cannot explain. We cannot explain the fluctuation of currencies after they have occurred,” declared St Louis Fed chief William Poole on Oct 9th. “I do not see any implication for inflation, at least with the magnitude of the US$ depreciation that we've seen so far. I did not see any evidence of a raft of dollar price increases for foreign goods, with the exception obviously of commodities. But for manufactured goods, I think the pass through is very, very small,” Poole said.
Yet soaring shipping rates and commodity prices are bound to be passed along to the final consumer. Is it any wonder why investors around the globe worry about hyper inflation, when central bankers can't speak the truth?
With so much riding on the Chinese economy for base metal and gold miners, exporters in Asia and Europe, and global sea borne shippers, the next questions are, “how high can the Shanghai red-chips fly?” Is Shanghai a major bubble about to burst, or can the market stay elevated, after a bout of profit-taking? Would a sharp decline in Shanghai red-chips undermine China's economy and commodities?
By Gary Dorsch,
Editor, Global Money Trends newsletter
http://www.sirchartsalot.com
This article is just the Tip of the Iceberg, of what’s available in the Global Money Trends newsletter! Here's what you will receive with a subscription, Insightful analysis and predictions for the (1) top dozen stock markets around the world, Exchange Traded Funds, and US home-builder indexes (2) Commodities such as crude oil, copper, gold, silver, the DJ Commodity Index, and gold mining and oil company indexes (3) Foreign currencies such as, the Australian dollar, British pound, Euro, Japanese yen, and Canadian dollar (4) Libor interest rates, global bond markets and central bank monetary policies, (5) Central banker "Jawboning" and Intervention techniques that move markets.
GMT filters important news and information into (1) bullet-point, easy to understand analysis, (2) featuring "Inter-Market Technical Analysis" that visually displays the dynamic inter-relationships between foreign currencies, commodities, interest rates and the stock markets from a dozen key countries around the world. Also included are (3) charts of key economic statistics of foreign countries that move markets.
A subscription to Global Money Trends is offered at only $150 US dollars per year for “44 weekly issues”, including access to all back issues. Click on the following hyperlink, to order now, http://www.sirchartsalot.com/newsletters.php Call toll free from USA to order, Sunday thru Thursday, 2 am to 4 pm EST, at 866-576-7872.
Mr Dorsch worked on the trading floor of the Chicago Mercantile Exchange for nine years as the chief Financial Futures Analyst for three clearing firms, Oppenheimer Rouse Futures Inc, GH Miller and Company, and a commodity fund at the LNS Financial Group.
As a transactional broker for Charles Schwab's Global Investment Services department, Mr Dorsch handled thousands of customer trades in 45 stock exchanges around the world, including Australia, Canada, Japan, Hong Kong, the Euro zone, London, Toronto, South Africa, Mexico, and New Zealand, and Canadian oil trusts, ADR's and Exchange Traded Funds.
He wrote a weekly newsletter from 2000 thru September 2005 called, "Foreign Currency Trends" for Charles Schwab's Global Investment department, featuring inter-market technical analysis, to understand the dynamic inter-relationships between the foreign exchange, global bond and stock markets, and key industrial commodities.
Copyright © 2005-2007 SirChartsAlot, Inc. All rights reserved.
Disclaimer: SirChartsAlot.com's analysis and insights are based upon data gathered by it from various sources believed to be reliable, complete and accurate. However, no guarantee is made by SirChartsAlot.com as to the reliability, completeness and accuracy of the data so analyzed. SirChartsAlot.com is in the business of gathering information, analyzing it and disseminating the analysis for informational and educational purposes only. SirChartsAlot.com attempts to analyze trends, not make recommendations. All statements and expressions are the opinion of SirChartsAlot.com and are not meant to be investment advice or solicitation or recommendation to establish market positions. Our opinions are subject to change without notice. SirChartsAlot.com strongly advises readers to conduct thorough research relevant to decisions and verify facts from various independent sources.
Gary Dorsch Archive |
© 2005-2022 http://www.MarketOracle.co.uk - The Market Oracle is a FREE Daily Financial Markets Analysis & Forecasting online publication.


