


Higher Stock Market Volatility
Stock-Markets / Volatility Oct 12, 2007 - 12:30 PM GMTBy: Marty_Chenard
 Yesterday, we discussed why the NYA Index (New York Stock Exchange) is an important index to watch ... because most of all the program trading occurs on it, and the large Institutional trades are found here.
We mentioned that, two of NYA things we watched was its Up Volume and Down Volume and mentioned that, together they were telling a story. We further noted only two comments in red: "Note that the peak level (of NYA UP Volume) was achieved 8 days ago, and the peaks have had lower tops since then." And ... we said, " If this condition persists (a high number of days with Down Volume above 10 million), that, we would see higher volatility in the days ahead. "
Yesterday showed us that higher volatility as the indexes moved up until 1 PM and then swooned the rest of the day. As a result, the VIX (Volatility Index) rose to a level that was higher than the previous 12 days of closing values and broke a resistance line to the upside . (See today's third chart below.)
We will take another look at the NYA's UpVolume and DownVolume charts this morning, and rather than re-explain what we said and why, we will point you to yesterday's update if you haven't read it at this link: Volumes .
Let's now look at the Up/Down NYA Volume for yesterday, and then how the VIX Volatility reacted.
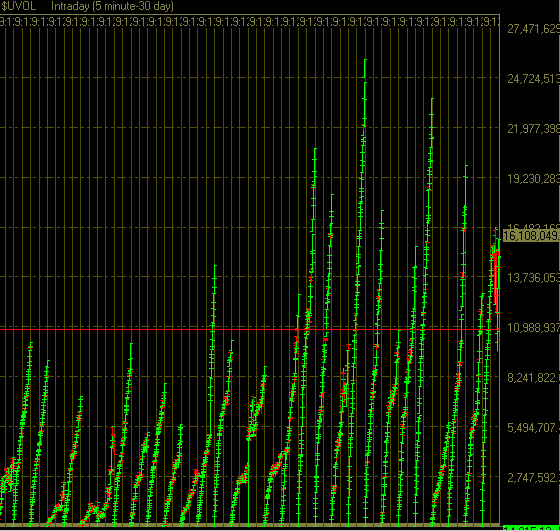
In this first chart, you can see data for Up Volume during the past 30 days. Each rising bar of data represents one day on a 5 minute tick basis. We can see that the NYA's Up Volume went under stress yesterday as it rose up to 16 million, and then erratically went up and down the rest of the day. It finally closed at 16 million which is a good sign because there was still plenty of buying in spite of all the selling. A negative that stands out, is the fact that the Up Volume is still making lower tops from its peak 9 days ago.
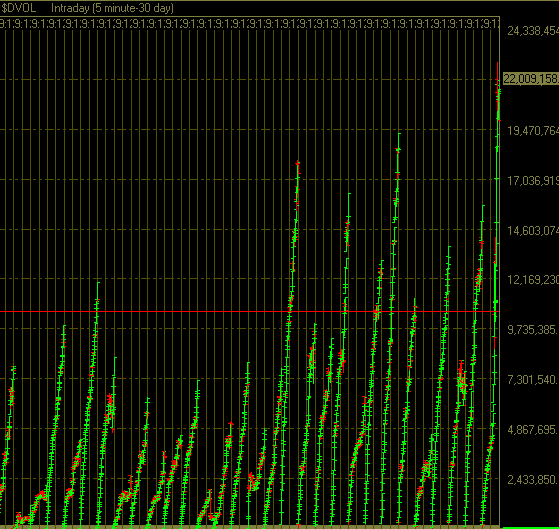
This chart shows the NYA's Down Volume for the same period of time.
Not surprisingly, we saw the NYA's Down Volume shoot up to a 30 day peak of 22 million giving us a net negative volume of 6 million for the day.
Next, we will look at how that affected the Volatility index ...
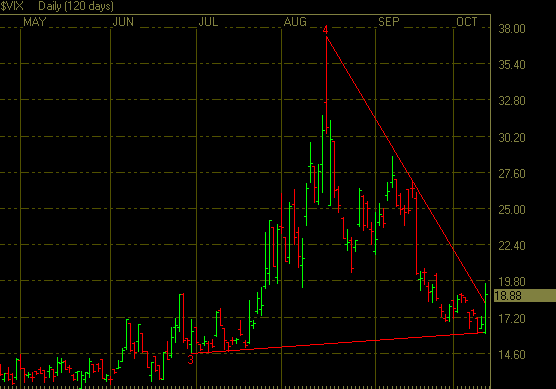
This is the VIX Index. Note how, the high amount of Down Volume days that we discussed yesterday, did indeed give us the rise in volatility that we expected.
Looking at the VIX chart below, you can see that the VIX rose high enough to take out the lows of the previous 12 days . In addition to that, the VIX broke its resistance line to the upside.
The magic of Bernanke's interest cut rate is now starting to wear off, and he will need to give us another cut if the earning's reports don't start coming in a little stronger than they have been. Most corporate CEOs are expecting weaker economic conditions 6 months from now, but on the positive side, they said that they saw no problems in raising their prices as an offset. That would be good for corporate profits, but not very good relative to the inflationary affect.
By Marty Chenard
http://www.stocktiming.com/
Please Note: We do not issue Buy or Sell timing recommendations on these Free daily update pages . I hope you understand, that in fairness, our Buy/Sell recommendations and advanced market Models are only available to our paid subscribers on a password required basis. Membership information
Marty Chenard is the Author and Teacher of two Seminar Courses on "Advanced Technical Analysis Investing", Mr. Chenard has been investing for over 30 years. In 2001 when the NASDAQ dropped 24.5%, his personal investment performance for the year was a gain of 57.428%. He is an Advanced Stock Market Technical Analyst that has developed his own proprietary analytical tools. As a result, he was out of the market two weeks before the 1987 Crash in the most recent Bear Market he faxed his Members in March 2000 telling them all to SELL. He is an advanced technical analyst and not an investment advisor, nor a securities broker.
Marty Chenard Archive |
© 2005-2022 http://www.MarketOracle.co.uk - The Market Oracle is a FREE Daily Financial Markets Analysis & Forecasting online publication.