


Stocks, Gold, and Municipal Bonds Get Abused
Stock-Markets / Financial Markets 2010 Nov 18, 2010 - 08:09 AM GMTBy: J_W_Jones

 Tuesday's stock market action reminded overconfident bulls that bears might be hibernating, but they are not dead. The S&P 500 lost nearly 20 points during intraday trading while most commodities, specifically oil and precious metals took it on the chin. Treasuries finally caught a bid, but did anyone notice the absolute meltdown that has been going on in municipal bonds? The Ishares National Municipal Bond ETF (MUB) was down only 0.50% on the day, but the chart below speaks for itself.
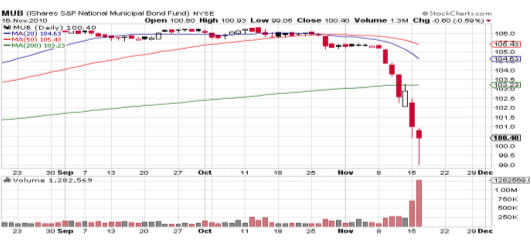
For those not familiar with bonds, this type of move is extraordinary. If this malaise is contagious and it infects the treasury market we could find ourselves in a precarious situation where interest rates are rising in lockstep with the dollar. If the dollar continues to rise, it would place additional pressure on stocks, commodities, and bonds. For most retail investors, there will be no place to hide.
The retail brokers who sold mom and pop bond mutual funds and promised them safety and higher yields will likely be receiving phone calls with angry folks on the other end of the horn. Retail investors are overweight with respect to bonds which will likely just add insult to injury for Main Street. The potential for ugly investment statements is likely due to the record inflows into bond mutual funds that have taken place over the past 2 years. The retail investor lost money on stocks following the financial crisis and now they are setup to lose money in bonds assuming the bond market goes through any serious selloff. For retail investors that potentially get caught in both storms, it is likely they may never return to financial markets.
Precious Metals
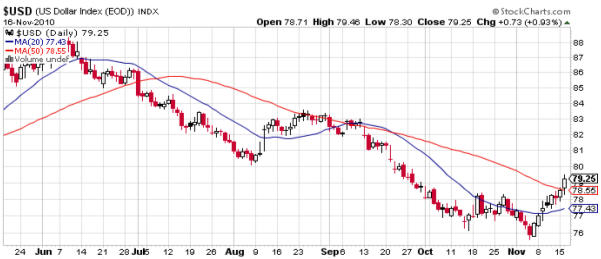
Gold and silver have both been under pressure as the dollar continues its rally. As can be seen from the daily chart of the dollar index below, the dollar has broken out above its 20 and 50 period moving averages.
It would likely not be a wise move to jump into gold at current prices expecting a pop. While gold may increase in price over the short run, if the dollar's daily chart remains above the 20 period moving average it offers a warning to would-be gold bulls. As can be seen below, the gold ETF GLD's price is hovering between support and resistance (Note: the 50 period moving average held Tuesday and will continue to be support until it is not.) At this point, there appears to be no edge directionally with regards to gold.
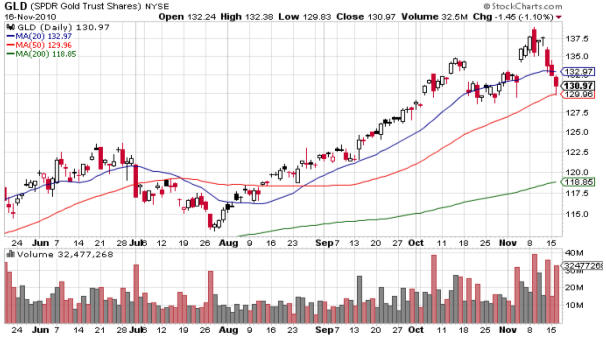
Should the 50 period moving average break down on GLD, lower prices should be expected in the near term. Even though the dollar has had a strong rally, higher prices could continue much longer than most traders expect. While a short term bounce in gold or silver may be likely, watching how price reacts to the 50 period moving average in coming days/weeks may give traders a clue as to which direction price is ultimately headed. Until then, it might prove wise to remain on the sidelines.
As pointed out above, bonds remain under pressure and a trade utilizing time decay (Theta) may be warranted in the ProShares UltraShort 20+ Year Treasury ETF (TBT). TBT's corresponding options are relatively liquid and it trades with weekly, as well as monthly expirations offering a wide choice of vehicles and trade constructions. The daily chart of TBT below indicates a consolidation area which may offer a solid risk/reward trade utilizing time decay.
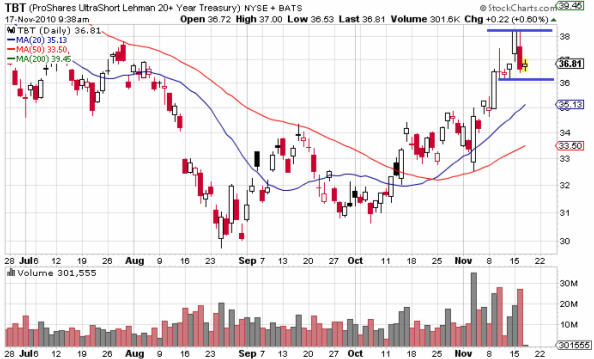
The lines drawn are around the 36 and 38 price points. A December call vertical would offer a solid risk/reward setup with risk crisply defined. The trade would obviously become profitable if the price of TBT were to climb higher. The trade setup would be as follows:
Buy 1 December TBT 36 Call - 1.85 / contract based on Tuesday's closing price
Sell 1 December TBT 38 Call - 1.00 / contract based on Tuesday's closing price
The following profitability chart corresponds with this trade.
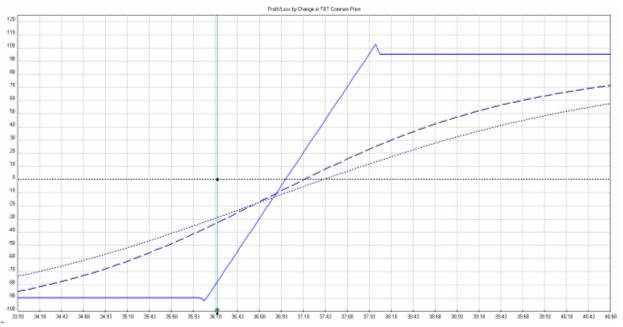
The maximum gain per leg would be $115 and would require the closing price on TBT on the December expiration to be at or above $38/share. Obviously an option trader could take profits before this time frame if an outsized move to the upside took place. The maximum risk on this trade is $85 per leg so at expiration a 100%+ return based on risk is achievable. In order to manage risk effectively, an option trader using this strategy could use a contingent stop based on the price of TBT to close this position if price were to fall. As a basic example, the trader could set the stop around the $35.25 area and reduce the risk of this trade further allowing the trader to have more flexibility regarding position sizing.
Treasuries could be well bid if investors begin fleeing to them if stocks continue to selloff. Additional QE II purchases by the Federal Reserve could also stabilize treasuries' prices. A trader who expected treasuries to rally could utilize a similar trade using puts and the same strikes could be used. The trade would be set up as follows:
Buy 1 December TBT 38 Put - 2.43 / contract based on Tuesday's closing price
Sell 1 December TBT 36 Put - 1.23 / contract based on Tuesday's closing price
The risk/reward profile is not nearly as attractive as the call vertical spread. The maximum gain would be around $80 per leg with the maximum loss around $120. Regardless, a potential 66%+ return is possible if at the December option expiration TBT is trading lower than $36/share.
The additional risks that are posed to this trade include a sudden increase in implied volatility. If implied volatility increased dramatically it would make the position less profitable until the eventual option expiration. It is also important to note that this strategy limits potential upside/downside if price extends past $38/share (call vertical) or if price pushes lower than $36/share (put vertical). If price dips below those prices at expiration, the trader would achieve the maximum gain on the spread, however the trader would not be rewarded for the additional rise/decline of price beyond those levels.
Obviously prices during trading hours Wednesday may cause this illustration to change dramatically. If that is the case, adjustments could easily be made. However, the trades described in this article are not a recommendation; instead my hope is that these hypothetical trades illustrate the power of options to enable traders to clearly define their risk and create favorable risk/reward trading setups.
Hopefully financial markets will begin to provide us with clues as to whether this is just a healthy correction or if the trend has changed and we are in for some serious downside. At this point, it is too early to tell. When the financial markets are in this type of price pattern, experienced traders typically reduce their position sizes, respect hard stops, and occasionally just watch the price action. A lot can be learned simply by watching the tape and the corresponding price action. Sometimes novice traders forget that the best trade can be no trade at all.
If you would like to continue learning about the hidden potential options trading can provide please join my FREE Newsletter: www.OptionsTradingSignals.com
J.W. Jones is an independent options trader using multiple forms of analysis to guide his option trading strategies. Jones has an extensive background in portfolio analysis and analytics as well as risk analysis. J.W. strives to reach traders that are missing opportunities trading options and commits to writing content which is not only educational, but entertaining as well. Regular readers will develop the knowledge and skills to trade options competently over time. Jones focuses on writing spreads in situations where risk is clearly defined and high potential returns can be realized.
This article is intended solely for information purposes. The opinions are those of the author only. Please conduct further research and consult your financial advisor before making any investment/trading decision. No responsibility can be accepted for losses that may result as a consequence of trading on the basis of this analysis.
© 2005-2022 http://www.MarketOracle.co.uk - The Market Oracle is a FREE Daily Financial Markets Analysis & Forecasting online publication.