


S&P 500, Treasuries, Gold, & Dollar are At Key Price Levels
Stock-Markets / Options & Warrants Nov 20, 2010 - 05:10 AM GMTBy: J_W_Jones

 Another example of Mr. Market playing games with traders and investors as equities and precious metals took part in a strong rally. Some market prognosticators noted short-term oversold conditions across the board while others discussed the potential for a strong reversal that could potentially take out recent highs. In addition to the regular banter, to the average retail investor the market sure looks rigged when the government decides to sell a large stake in a massive IPO offering and a shaky tape suddenly becomes stronger than garlic.
There is a lot going on in the news as of late, and the expiration of the Bush tax cuts looms large on the minds of many, particularly small business owners. So the real question becomes, what should traders be watching or paying attention to before the light volume Thanksgiving week? The answer is simple, watch the tape! The market will provide plenty of clues and it will eventually tip its hand, experienced traders will wait for this process to unfold.
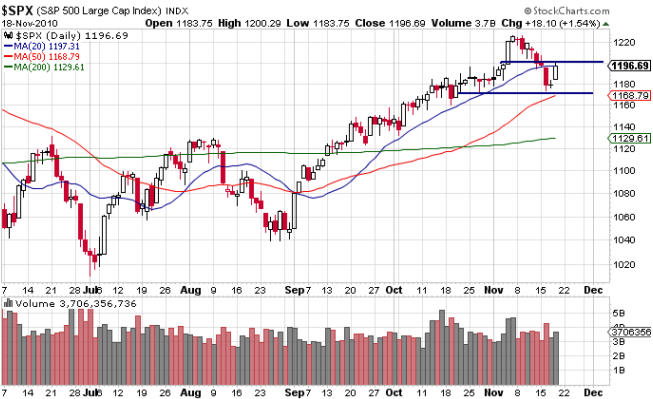
At this point in time, it is a bit early to begin making predictions as to which direction the equities market will go. What we do know is that the market was oversold in the short-term, so this could be a pause before prices turn lower. In contrast, this could be the beginning of another bullish move breaking recent highs on its way to a “Santa Claus” rally. My stance is neutral at this point in time; S&P 1200 should offer significant overhead resistance while S&P 1170 / 50 period moving average is near term support. The chart listed below illustrates these key levels:
S&P 500
If price were to break out above S&P 1200 on strong volume, it is likely that we will see a retest of the recent highs around the 1220 area. Consequently, if price tests the S&P 1170 area and fails price will likely be magnetized to the 1140-1150 area. We will have our answers in due time, but until a definite direction is known, patience is warranted.
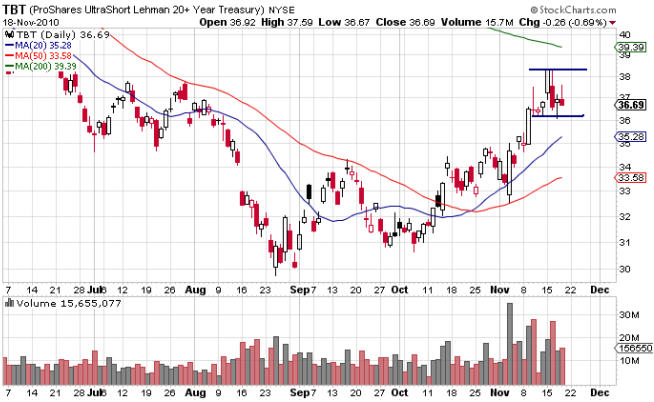
Treasuries
As discussed in my previous article, the ProShares Ultra Short 20+ year treasury ETF (TBT) bounced off of the 36 level and put on a short lived rally only to settle toward the bottom 1/3 of its recent price range. After the recent breakout, it would be constructive to see TBT consolidate before confirming a direction. The chart below shows the key levels on TBT:
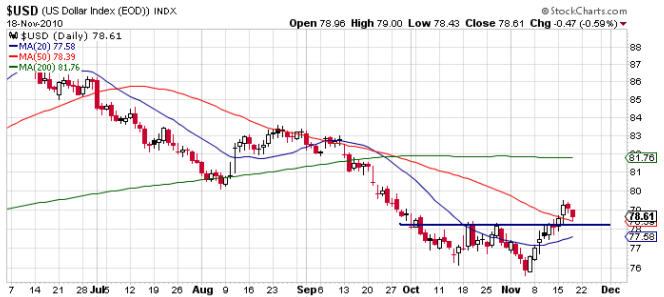
U.S. Dollar
Instead of illustrating a gold chart, let us focus our attention on the U.S. Dollar Index. The chart below shows the dollar has pulled back and is now testing the 50 period moving average. I am anticipating a retest of the recent breakout over double tops and this key level is illustrated below. If support holds firm, higher prices for the U.S. Dollar in the near term will be likely.
The Contrarian Trade
Thursday’s price action in the S&P 500 offers a great example of the power of options, which are traditionally overlooked by most equity traders or investors. While I did not personally enter this trade, I did enter a short position with tight stops around the S&P 1197 level using futures contracts for a short term trade. I was looking for a short term decline which we subsequently received in the aftermarket and my limit orders were triggered.
The option trade that I discussed with one of my trading buddies and mentor, involved getting short Apple (AAPL) when its price was around $309.50/share. While I did not place this trade as I felt I had plenty of short side exposure via my e-mini futures position, the trade would have worked quite well. So the trade listed below is not a recommendation, but an illustration of how options can be a contrarian traders’ best friend.
AAPL has been trading in the $300 – $320 per share range for several weeks having broken out above $320 only to be smacked down into the range. During the recent selloff, AAPL crossed down through the $300 level only to encounter strong buying that pushed it above the key $300 area by the close of trade that day. Thursday’s rally had AAPL trading above $309.50/share and the 20 period moving average was right around the 310 level as can be seen from the chart below.
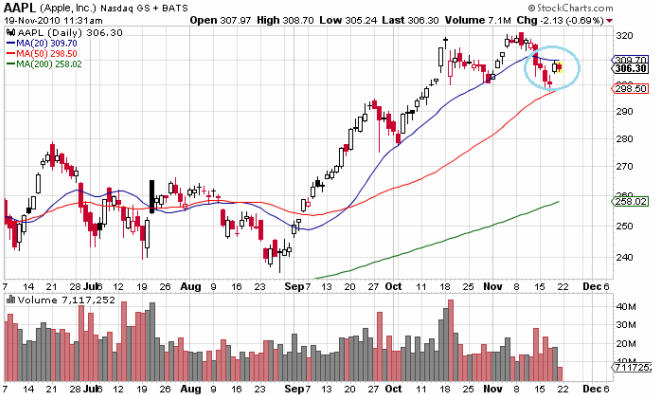
The 20 period moving average provides an adept option trader with a key level which he/she can define the risk of a short position using options. Through the utilization of a contingent stop based on AAPL’s stock price, a trader using this setup could place a stop around the $311.25 area to define their ultimate risk. As of Thursday, the AAPL weekly options that expire November 26 began trading.
The trade listed below is a put debit spread:
Buy 1 AAPL Nov. 26 310 Weekly Put – $5.00 / contract
Sell 1 AAPL Nov. 26 300 Weekly Put – $1.47 / contract
AAPL stock closed around $308.43 / Share
The profitability chart reflecting this trade is below:
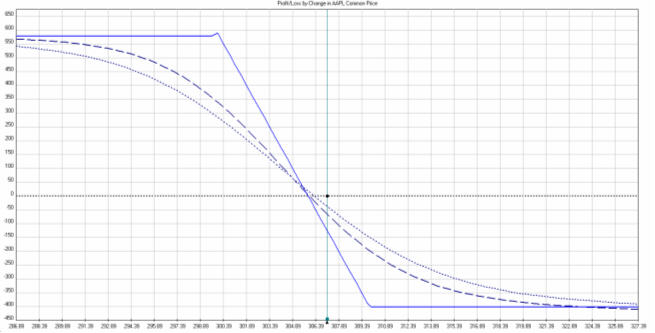
The maximum risk this trade has per leg was around $350, however through the use of the contingent stop around $311.25, the risk per leg is around $150. The maximum gain would be $650 per leg if at expiration in one week AAPL was trading below $300/share. In the first hour of trading, AAPL sold off below $306 per share. If an option trader had more than one contract on, he/she could take partial profits and place a stop at the entry price insuring a winning trade and allowing room for the trade to run.
Obviously the trader may want to adjust his/her stop based on market conditions, but this is simply an example of what can be accomplished with options. Once the trader understands how to determine the risk that an option trade assumes, he/she can build trade constructions to fit nearly any trading style or strategy. For a contrarian trader, options offer an unbelievable opportunity to mitigate risk and maximize profits. Learning how to trade options does take time and effort, but the potential returns options offer when they are used appropriately are unparalleled.
If you would like to continue learning about the hidden potential options trading can provide please join my FREE Newsletter: www.OptionsTradingSignals.com
J.W. Jones is an independent options trader using multiple forms of analysis to guide his option trading strategies. Jones has an extensive background in portfolio analysis and analytics as well as risk analysis. J.W. strives to reach traders that are missing opportunities trading options and commits to writing content which is not only educational, but entertaining as well. Regular readers will develop the knowledge and skills to trade options competently over time. Jones focuses on writing spreads in situations where risk is clearly defined and high potential returns can be realized.
This article is intended solely for information purposes. The opinions are those of the author only. Please conduct further research and consult your financial advisor before making any investment/trading decision. No responsibility can be accepted for losses that may result as a consequence of trading on the basis of this analysis.
© 2005-2022 http://www.MarketOracle.co.uk - The Market Oracle is a FREE Daily Financial Markets Analysis & Forecasting online publication.