


Global Stock Markets SPX, DJW, FTSE, TSX, BSE, and HSI Elliott Wave Analysis and Forecasts
Stock-Markets / Elliott Wave Theory Nov 20, 2010 - 07:14 AM GMTBy: Tony_Caldaro

 The equity market started the week by extending the pullback, and then rebounded to end the week nearly unchanged. Economic reports for this past week were mostly positive. On the negative side were the NY FED index, weekly MBA mortgage applications, housing starts and weekly jobless claims. The BEA leading indicator led the positive economic reports, along with retails sales, the PPI/CPI, the Philly FED, industrial production, business inventories, building permits, and the weekly WLEI. The monetary base and the NAHB housing index remained steady.
For the week the SPX/DOW were +0.05%, and the NDX/NAZ were -0.05%. Asian markets lost 2.4%, European markets gained 0.7%, the Commodity equity group gained 0.6%, and the DJ World index was off 0.2%. Bonds were -1.3%, Crude lost 3.5%, Gold was -1.1% and the USD gained 0.4%. Next week’s holiday shortened week will be highlighted by Q3 GDP, the FOMC minutes, and Durable goods orders.
LONG TERM: bull market
It was just two weeks ago the SPX made a new bull market high at 1227. This new marginal high, the previous high was SPX 1220 in April, ran into short term resistance at this level and the market pulled back into this week. This is quite normal for advances in bull markets. The weekly RSI was quite overbought and the pullback sets up the potential for a common negative RSI divergence on the next series of new highs. The weekly MACD continues to move higher, suggesting the July-Nov uptrend remains intact. We continue to count this uptrend as Major wave 1 of Primary wave III, in an ongoing five primary wave bull market.
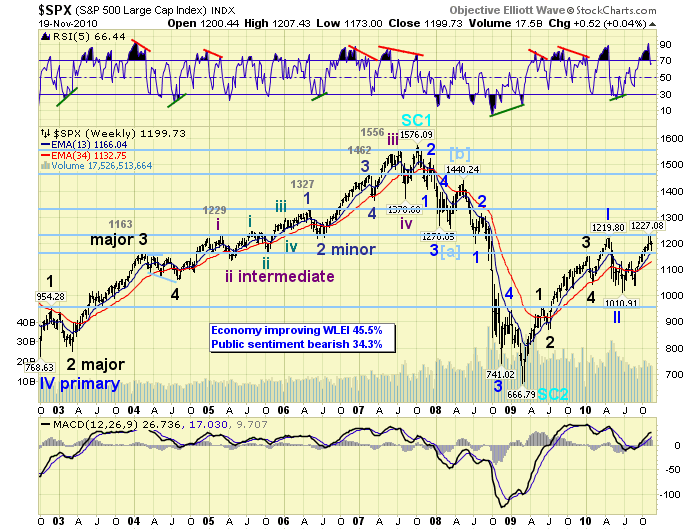
While the US SPX index was making new bull market highs, other indices around the world were also making new bull market highs as well. This is a global event. We selected a few of the 15 major indices we track and post their charts below.
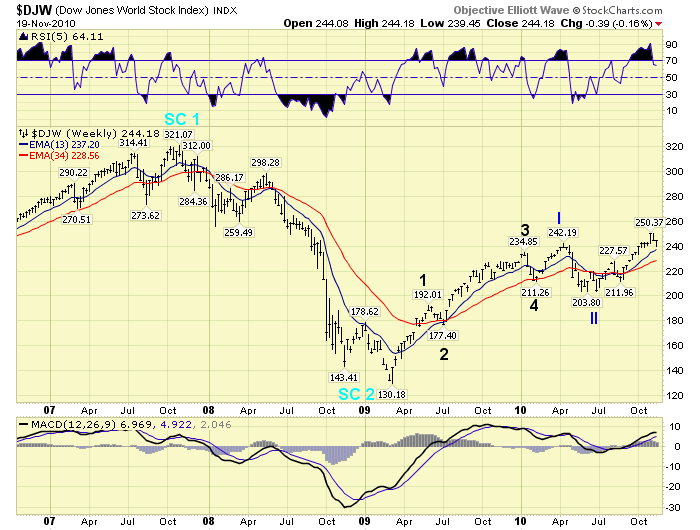
First we display the DJ World index. Notice the wave pattern from the March 2009 low remains exactly the same as the SPX.
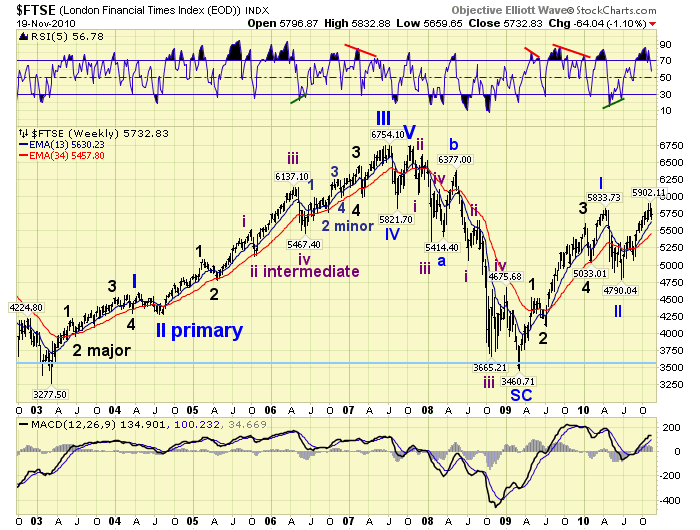
Next we display England’s FTSE. Again the same five wave pattern into the April 2010 high, a correction, and then new bull market highs. Also notice the similar patterns of the weekly RSI and MACD.
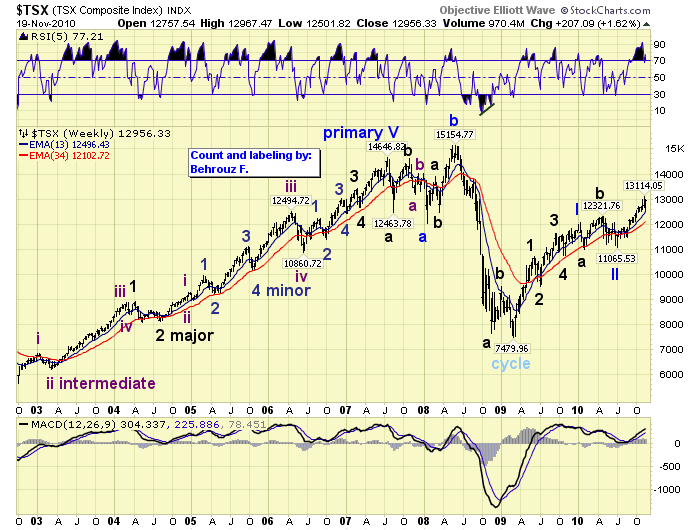
Third is Canada’s TSX. This is one of three foreign indices we track in the Commodity equity group. In this chart you will observe a slight deviation of the Primary wave II corrective pattern. It was an irregular flat that started in Jan 2010. Yet again, after the July low new bull market highs.
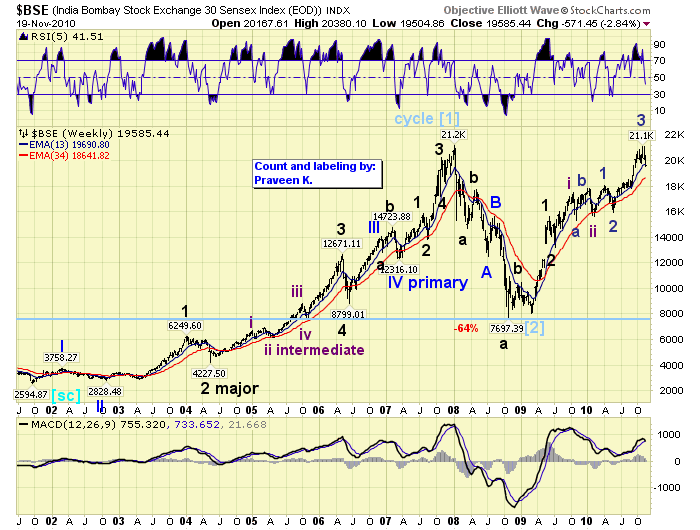
Fourth on our list is India’s BSE (Sensex). This bull market pattern also started in March 2009. Yet notice how different it is in its wave structure. Each country’s equity market unfolds with its own specific pattern. Recently the Sensex challenged the its all time bull market high and was turned away on this first attempt.
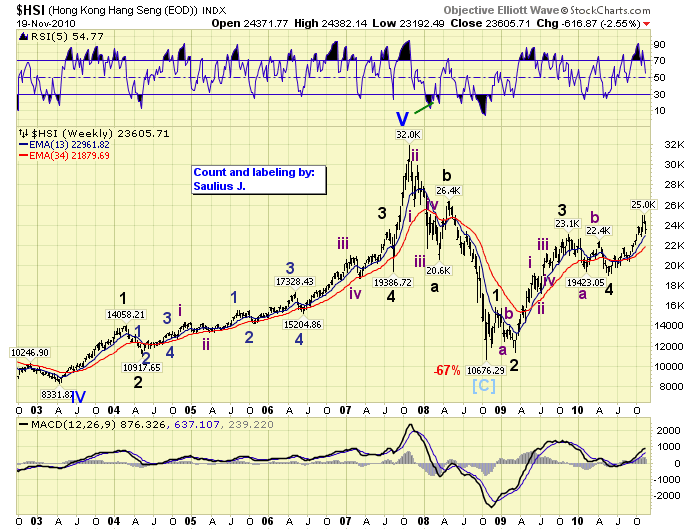
Last we present Hong Kong’s HSI. This bull market started right after the worldwide asset liquidation in October 2008. Again, a slightly different bull market pattern making new bull market highs.
While many foreign markets move in slightly different wave patterns during global bull and bear markets. Most get into sync with each other when the long term trend is about to change. Currently, many continue to unfold in their own specific patterns suggesting the global bull market has plenty of time ahead of it. To review all foreign indices we track using OEW go to pages 7, 8 and 9 using the following link: http://stockcharts.com/def/servlet/Favorites.CServlet?obj=ID1606987.
MEDIUM TERM: uptrend high SPX 1227
After completing five Major waves up from the March 2009 bear market low at SPX 667. Primary wave I completed in April 2010 at SPX 1220, and the market entered a three month Primary wave II correction ending at SPX 1011. Since then the market has been in a confirmed uptrend, now in its fourth month, and we are tracking this advance as Major wave 1 of Primary wave III. Our expectations for this uptrend, when we projected a potential scenario for the rest of the bull market in September 2010: http://caldaro.wordpress.com/2010/09/26/spx-bull-market-projection/, has been for a six month uptrend, ending in January 2011, at around the OEW 1313 pivot. Thus far our projection remains on track in time, but price has a lot of work to do on the upside to reach that target. Technicals remain good. Eight of the nine SPX sectors remain in uptrends, and 12 of the 15 foreign markets remain in uptrends as well.
The internal wave structure of this Major wave 1 uptrend is unfolding in five Intermediate waves: Int. wave one Aug10 at SPX 1129, Int. wave two Aug10 at SPX 1040, Int. wave three Nov10 at SPX 1227, and Int. wave four may have bottomed this week at SPX 1173. Intermediate wave two was a relatively complex pullback lasting about three weeks, declined 89 SPX points, and was oversold twice on the daily RSI. The recent Intermediate wave four was a simple structure lasting only about a week, declined 54 SPX points, and hit oversold once on the daily RSI. We have alternation between the two pullbacks.
SHORT TERM
Support for the SPX remains at 1187 and then 1176, with resistance at 1222 and then 1240. Short term momentum ended the week slightly overbought. After double topping at SPX 1227 on tuesday Nov 9th, a negative RSI hourly divergence appeared and the market started to pullback. The SPX could not clear the OEW 1222 pivot range. This pullback lasted one week and bottomed when the SPX hit 1173 just before the close this past tuesday. After several attempts to rally on wednesday the market gapped up on thursday, hit SPX 1200, and then pulled back. This turned the short term OEW charts positive for the first time in over a week. On friday the market worked its way back to SPX 1200 and closed there. This suggests that Intermediate wave four ended on tuesday at SPX 1173. We upgraded the count form a tentative “green” labeling to a “purple” wave labeling.
During the four day week ahead the SPX needs to hold the OEW 1187 pivot range, ( 7 pts.), to keep this count in effect. Overhead resistance is minimal until the OEW 1222 pivot range is reached. Once this pivot is cleared we could get quite a rally into year end. While we can not rule out of retest of the SPX 1173 level, probabilities suggest it was the low for Int. wave four. Should the market turn lower there is good support at the 1168 and then the 1146 OEW pivot. Once the market clears SPX 1207 it should be on its way higher. Best to your trading!
FOREIGN MARKETS
Asian markets lost 2.4% on the week. India’s BSE confirmed a downtrend.
European markets gained 0.7% on the week. Spain’s IBEX remains in a downtrend.
The Commodity equity group gained 0.6% on the week. Brazil’s BVSP confirmed a downtrend.
The DJ World index remains in an uptrend and lost 0.2% on the week.
COMMODITIES
Bonds are in a confirmed downtrend and were -1.3% on the week. The 10YR rate has risen from 2.33% to 2.96%.
Crude lost 3.5% on the week as it struggles to hold onto its uptrend.
Gold lost 1.1% on the week and appears to be in a downtrend, yet unconfirmed.
The uptrending USD gained 0.4% on the week. The downtrending EURUSD was flat, while the now downtrending JPYUSD lost 1.3%.
NEXT WEEK
A busy economic week ahead all condensed into just two days due to the Thanksgiving holiday on thursday. On tuesday, the first revision to Q3 GDP, Existing home sales and the FOMC minutes. Then on wednesday, Personal income/spending, PCE prices, Durable goods orders, the weekly Jobless claims, UofM Consumer sentment, New home sales, and finally the FHFA housing price index. Traders will likely take both thursday and friday off after that two day 1-2 punch, and volume will be light on friday. The FED has nothing scheduled for next week. Best to your week and upcoming Holidays!
CHARTS: http://stockcharts.com/def/servlet/Favorites.CServlet?obj=ID1606987
By Tony Caldaro
http://caldaroew.spaces.live.com
After about 40 years of investing in the markets one learns that the markets are constantly changing, not only in price, but in what drives the markets. In the 1960s, the Nifty Fifty were the leaders of the stock market. In the 1970s, stock selection using Technical Analysis was important, as the market stayed with a trading range for the entire decade. In the 1980s, the market finally broke out of it doldrums, as the DOW broke through 1100 in 1982, and launched the greatest bull market on record.
Sharing is an important aspect of a life. Over 100 people have joined our group, from all walks of life, covering twenty three countries across the globe. It's been the most fun I have ever had in the market. Sharing uncommon knowledge, with investors. In hope of aiding them in finding their financial independence.
Copyright © 2010 Tony Caldaro - All Rights Reserved Disclaimer: The above is a matter of opinion provided for general information purposes only and is not intended as investment advice. Information and analysis above are derived from sources and utilising methods believed to be reliable, but we cannot accept responsibility for any losses you may incur as a result of this analysis. Individuals should consult with their personal financial advisors.
© 2005-2022 http://www.MarketOracle.co.uk - The Market Oracle is a FREE Daily Financial Markets Analysis & Forecasting online publication.