


SPX Retraces 50% of Decline, VIX Another False Break?
Stock-Markets / Financial Markets 2010 Nov 21, 2010 - 06:22 AM GMT

 FDIC Keeps a Low Profile. -
The FDIC Failed Bank List announced three new bank closures this week.
FDIC Keeps a Low Profile. -
The FDIC Failed Bank List announced three new bank closures this week.
(ZeroHedge) Ben Bernanke has made a very dangerous bet.
The Fed’s Quantitative Easing 2 announcement of $600 billion in additional Treasury purchases is literally a “bet the farm” move. True, the Fed had already engaged in an unbelievable amount of bailouts both known and unknown. However, the Fed’s previous moves were all made when 1) the world financial system was teetering on the brink of collapse and 2) other countries were engaging in similar practices.
In contrast, the Fed’s new QE 2 announcement comes at a time when the consensus is that the US economy is recovering (I don’t buy it, but most analysts/ commentators do) and other central banks have publicly declared they won’t be engaging in additional easing (the ECB and UK) or are outright tightening credit and raising interest rates (China and Australia).
Geithner Warns Republicans Against Politicizing the Fed
(Bloomberg) .S. Treasury Secretary Timothy F. Geithner said the Obama administration would oppose any effort to strip the Federal Reserve of its mandate to pursue full employment and warned Republicans against politicizing the central bank. It’s just smoke and mirrors, folks.
Another False Break for the VIX?
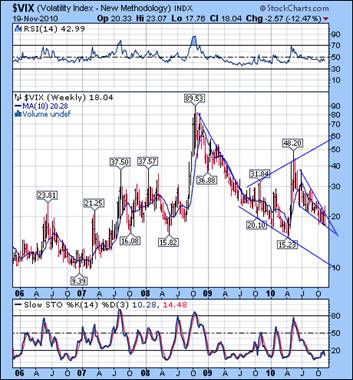 --The VIX pierced the upper trendline of its wedge on Tuesday. By Friday the VIX made a new low, invalidating its old sell signal. Or did it? The weekly chart does not reveal the five-point reversal pattern in the VIX. Late on Friday it acquired point five.
This is a very dangerous situation, since many traders that watch the VIX have relaxed their view of the market. A declining VIX usually broadcasts an “all clear.” Unfortunately, the meaning in the context of a Broadening Formation is the exact opposite. The only question is, how quickly will the market reverse?
SPX retraced 50% of its initial decline.
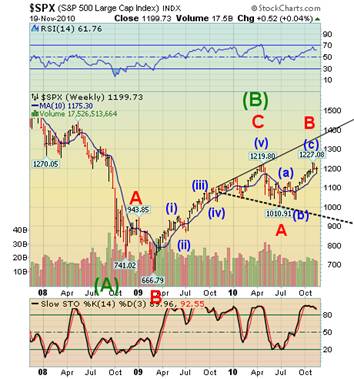 The SPX reversed from its 61.8% Fibonacci Retracement of the 2007-2009 decline. The SPX dropped to its 10-week moving average, and then proceeded to make a 50% retracement of its decline from the top. It is now ready for a waterfall decline that Edwards & McGee made famous as the Orthodox Broadening Top.
Normally a 50% retracement is all that is needed to finish the final rally in a Broadening Top formation. However, the single EW rule that defies that logic would be a B wave. Since the favored pattern is a double zig zag in the SPX, I see this pattern now lining up with the NDX, which has a simpler A-B-C pattern.
The NDX is in sync with the SPX.
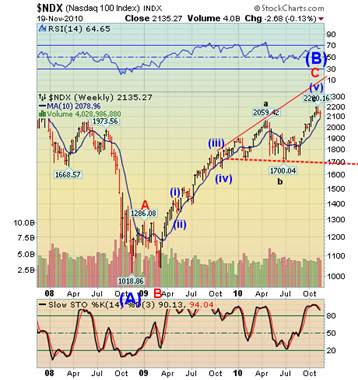 --The Orthodox Broadening Top is now complete. The test of the 10-week moving average at 2078.96 is now complete and a reversal pattern is also in place. My Model now suggests that a very sharp decline to Model Support and the Lower Broadening Top trend line may begin.
My observation from last week, “If this week follows an oft-traveled path, we may see a short-term low by mid-week and a wave ii secondary peak by Friday.” was on the mark.
The initial target of the coming decline is the lower trendline of the Orthodox Broadening Top formation.
Gold tests its supports.
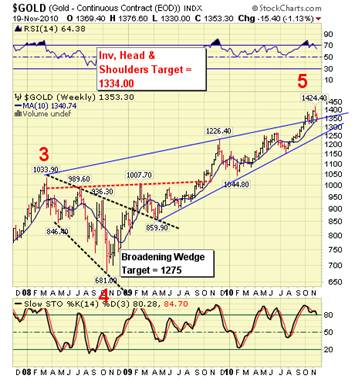 -- Gold has now tested its Wedge trendline and 10-week moving average, which coincidentally are in the same location. It also has made a reversal pattern indicating a decline is forthcoming. The next target for gold is the lower trendline of the Wedge.
We will soon see whether the Fed and its POMOs can keep the markets elevated. The evidence is mounting that they cannot.
$WTIC completed a seventh wave within its Broadening Top.
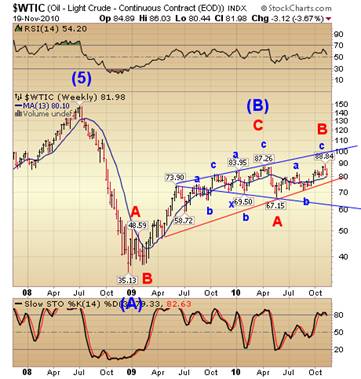 -- $WTIC completed a 7th point in its Broadening Top, keeping in line with the same EW pattern as the SPX. What is different, however, is that the retracement rally was a failure. The immediate Model target for $WTIC is 70.00, but it would be no surprise to see it decline to the lower Broadening Top trendline.
I have changed the EW pattern slightly to match the pattern in the SPX. After 16 months of corrective chaos, the price of oil is about to plunge.
The Bank Index remains stalled at the Diamond Breakout.
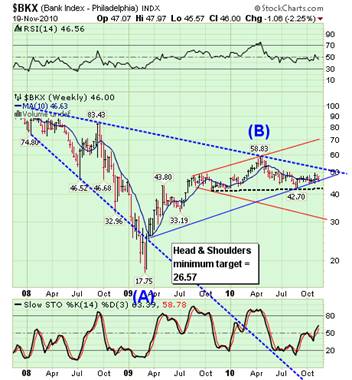 --The $BKX remains stalled just above the lower trendline of its Diamond formation, but now below the 10-week moving average at 46.63. The BKX has now activated a powerful sell signal whose target may be the lower trendline of the Orthodox Broadening Top.
The banks continue to extend and pretend, but the perception of the general public is changing and price is finally beginning to reflect it. Too many analysts refuse to view the BKX as a leading indicator of things to come. The other indexes don’t appear threatened yet, but BKX is teetering on the edge. The rest will follow.
The Shanghai Index is at a crossroads.
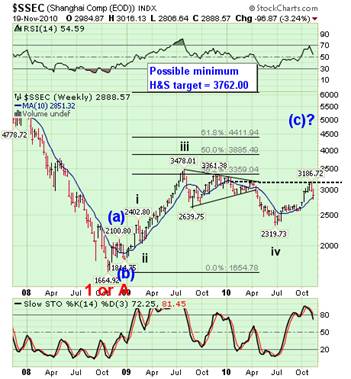 --The Shanghai Index reversed from the apex of its triangle, leaving a potential Head & Shoulders neckline. It has reversed to its 38.2% retracement and has no overlaps. This is very important, since a rally from here would be the start of a fifth wave and a breakout of the neckline. The H&S minimum target is very near the 50% retracement of the 2007-2008 decline.
Despite (or maybe because of) China’s raising banking reserve requirements to slow their economic growth, it is attracting hot money that is also filtering into their stock market.
$USB appears ready for a reversal.
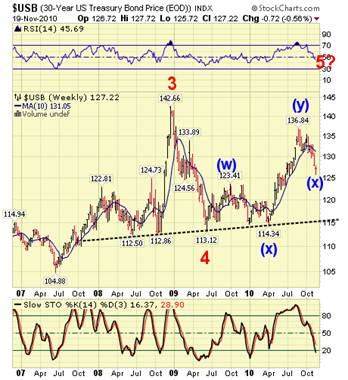 -- $USB appears to have begun a reversal from a double zigzag low last week. It also has the ability to rally higher. Monday’s Pivot took hold and $USB closed the week on an up note. Should the equities market fail, the long bond will be sought after as a safe haven for investors. If it continues within its weekly trading channel since 1995, we may see a high over 150 in $USB. A potential target may be 155.00.
$USD is on a confirmed buy signal.
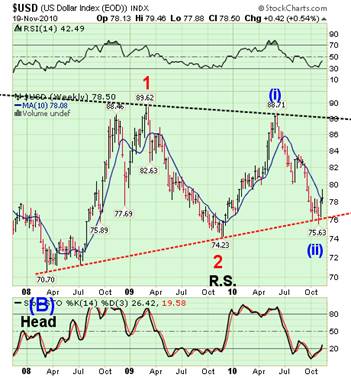 -- $USD confirmed a weekly buy signal last week by closing above its 10-week moving average. It broke above its October highs, giving an indication of future strength. It appears that the up-trend may now be gathering strength.
There are a couple of variations to the pattern we are observing on the weekly chart. One obvious pattern is the triangle, which is not unusual in an A-B-C correction of this magnitude. It simply says that the next move higher will be the final one. Unlike the 4th wave triangles that infer a limited 5th wave, this does not.
Traders alert: The Practical Investor is currently offering the daily Inner Circle Newsletter to new subscribers. Contact us at tpi@thepracticalinvestor.com for a free sample newsletter and subscription information.
Our Investment Advisor Registration is on the Web
We are in the process of updating our website at www.thepracticalinvestor.com to have more information on our services. Log on and click on Advisor Registration to get more details.
If you are a client or wish to become one, please make an appointment to discuss our investment strategies by calling Connie or Tony at (517) 699-1554, ext 10 or 11. Or e-mail us at tpi@thepracticalinvestor.com .
Anthony M. Cherniawski, President and CIO http://www.thepracticalinvestor.com
As a State Registered Investment Advisor, The Practical Investor (TPI) manages private client investment portfolios using a proprietary investment strategy created by Chief Investment Officer Tony Cherniawski. Throughout 2000-01, when many investors felt the pain of double digit market losses, TPI successfully navigated the choppy investment waters, creating a profit for our private investment clients. With a focus on preserving assets and capitalizing on opportunities, TPI clients benefited greatly from the TPI strategies, allowing them to stay on track with their life goals
Disclaimer: The content in this article is written for educational and informational purposes only. There is no offer or recommendation to buy or sell any security and no information contained here should be interpreted or construed as investment advice. Do you own due diligence as the information in this article is the opinion of Anthony M. Cherniawski and subject to change without notice.
Anthony M. Cherniawski Archive |
© 2005-2022 http://www.MarketOracle.co.uk - The Market Oracle is a FREE Daily Financial Markets Analysis & Forecasting online publication.