


Stock Market Elliott Wave Count Weekend Update - 27th Nov
Stock-Markets / Stock Markets 2010 Nov 27, 2010 - 10:32 AM GMTBy: Tony_Caldaro

 After four gapped openings in four trading days the US markets ended the week mixed. Economic reports for this week continued the upward trend of improving numbers. Q3 GDP was revised higher to 2.5%. Personal income/spending rose, weekly jobless claims fell to their lowest level in many months, weekly mortgage application rose, consumer sentiment moved higher, the WLEI continued to rise, and PCE prices were flat.
On the negative side, existing/new homes sales fell, along with FHFA home prices, and durable goods orders turned negative. For the week the SPX/DOW were -0.95%, while the NDX/NAZ were +0.80%. Asian markets were -1.3%, European markets were -2.4%, the Commodity equity group was -0.7%, and the DJ World index dropped 2.0%. Bonds were +0.1%, Crude gained 2.1%, Gold rose 0.8%, and the USD soared 2.2%. Next week will be highlighted by the monthly Payrolls report, ISM, Auto sales and the FED’s Beige book.
LONG TERM: bull market
OEW analysis continues to confirm a long term uptrend from the Mar09 SPX 667 low. This uptrend, at first, unfolded in five Major waves to complete a Primary wave I in Apr10 at SPX 1220. The five Major waves were as follows: Major 1 SPX 956 Jun09, Major 2 SPX 869 Jly09, Major 3 SPX 1150 Jan10, Major 4 SPX 1045 Feb10, and Major 5 SPX 1220 Apr10. After the completion of Primary wave I, Primary wave II unfolded into a Jly10 low of SPX 1011. Since then the market has been rising in a medium term uptrend, and we are labeling this wave Major wave 1 of Primary wave III. The weekly chart below displays the 2002-2007 bull market, the 2007-2009 bear market, and the current bull market.
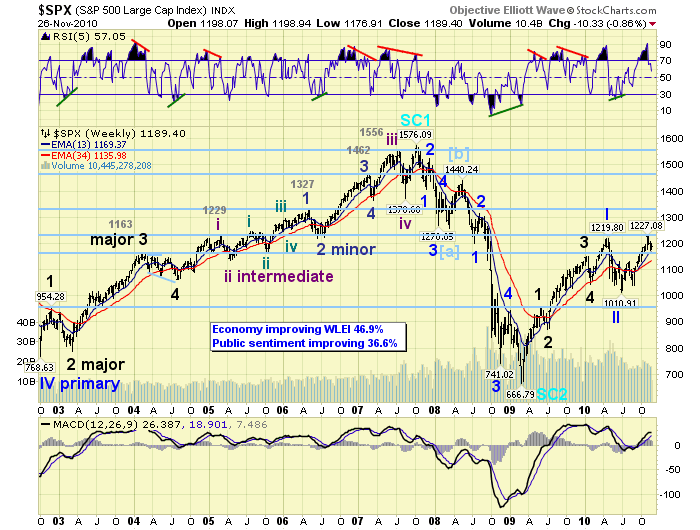
Notice, during the 2002-2007 bull market each impulsing uptrend took the market to new bull market highs. Then inversely, during the 2007-2009 bear market, each downtrend took the market to new bear market lows. The current uptrend, from the Jly10 SPX 1011 low, has already made a new bull market high. This is the typical market action during bull and bear markets. Also observe the weekly MACD. It remains above neutral during bull markets and below neutral during bear markets. It is currently above neutral and rising. It’s a bull market!
MEDIUM TERM: uptrend
From the Primary wave II low in July the market started this uptrend - Major wave 1. The first rally carried the SPX to 1129, we labeled that Intermediate wave one of Major wave 1. A sharp pullback followed to SPX 1040 which was labeled Intermediate wave two. Then the market rallied to new highs at SPX 1227 and we labeled that rally Intermediate wave three. For the past couple of weeks the market has been in an Intermediate wave four pullback. This pullback has been 54 points (SPX 1227-1173), the largest pullback since the 89 point (SPX 1129-1040) pullback of Intermediate wave two. The numbers 54 and 89 just happen to be fibonacci numbers.
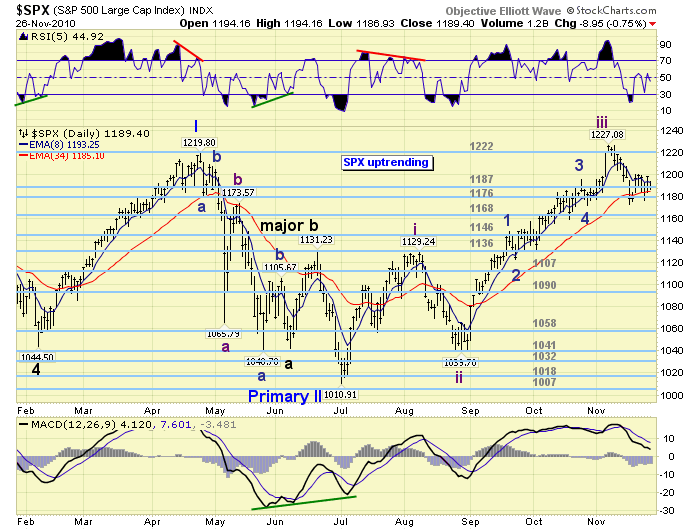
The current pullback has already met the minimum requirements for its completion. Its wave structure was a simple zigzag versus the more complex zigzag of Intermediate wave two – alternation. The decline triggered an oversold RSI condition on the daily chart. The pullback hit SPX 1173 within the range of the OEW 1176/1168 pivots. This was also support for the previous fourth wave of a lesser degree – Minor wave 4. We observe a similar consolidation period at both the Intermediate wave two and four lows. We might also add that Intermediate wave one started at the beginning of July, and Intermediate wave three in the beginning of September. Only two trading days left in November.
SHORT TERM
Support for the SPX remains at 1187 and then 1176, with resistance at 1222 and then 1240. Short term momentum was approaching oversold at friday’s close. The short term OEW charts have flipped back and forth between a positive and negative bias for most of the week, and ended the week on the negative side. This week the market had a gapped opening everyday: three down and one up. Quite choppy activity in what appears to be consolidation. The key price levels to observe going into the next week are SPX 1177 and then 1173 on the downside. A drop below these levels should lead to more selling pressure. On the upside we have SPX 1199 and then 1207. A breakout above these levels should lead to higher prices.
The OEW 1187 pivot has acted like a fulcrum during this pullback. The 1176 pivot range has been support. A break below this pivot will find immediate support within the 1168 pivot range. These three closely nested pivots have worked quite well in supporting this pullback. Should the 1168 pivot fail the next support is at the 1146 and then 1136 pivots. These two pivots are major support for this uptrend. Best to your trading!
FOREIGN MARKETS
Asian markets were mostly lower on the week (-1.3%). Only India’s BSE is in a confirmed downtrend, but Hong Kong’s HSI is also weak.
European markets were mostly lower as well (-2.4%). Only Spain’s IBEX is in a confirmed downtrend, but the STOX50 is also weak.
The Commodity equity group, (BVSP, RTSI and TSX), were mostly lower (-0.7%). Only Brazil’s BVSP is in a confirmed downtrend. The other two are quite strong.
The DJ World index remains in an uptrend, but lost 2.0% on the week.
COMMODITIES
Bonds were +0.1% on the week. 10YR yields continue to uptrend.
Crude maintains its uptrend and gained 2.1% on the week.
Gold gained 0.8% on the week. It still remains in an uptrend, but we believe the uptrend topped at $1,424 and it is pulling back in a correction.
The USD rallied 2.2% on the week as its uptrend continues. The downtrending EURUSD lost 3.1%, and the downtrending JPYUSD lost 0.7%.
NEXT WEEK
Busy week ahead. On tuesday we’ll have reports from Case-Shiller, the Chicago PMI and the Consumer confidence reading. Wednesday, the ADP index, Productivity, ISM manufacturing, Construction spending, monthly Auto sales and the FED’s beige book. Thursday, weekly Jobless claims and Pending home sales. Then on friday the monthly Payrolls report, the Unemployment rate, Factory orders and ISM services. On wednesday FED vice chairman Yellen gives a speech, and on thursday FED governor Duke gives a speech at the Philly FED. Best to your weekend and week!
CHARTS: http://stockcharts.com/def/servlet/Favorites.CServlet?obj=ID1606987
By Tony Caldaro
http://caldaroew.spaces.live.com
After about 40 years of investing in the markets one learns that the markets are constantly changing, not only in price, but in what drives the markets. In the 1960s, the Nifty Fifty were the leaders of the stock market. In the 1970s, stock selection using Technical Analysis was important, as the market stayed with a trading range for the entire decade. In the 1980s, the market finally broke out of it doldrums, as the DOW broke through 1100 in 1982, and launched the greatest bull market on record.
Sharing is an important aspect of a life. Over 100 people have joined our group, from all walks of life, covering twenty three countries across the globe. It's been the most fun I have ever had in the market. Sharing uncommon knowledge, with investors. In hope of aiding them in finding their financial independence.
Copyright © 2010 Tony Caldaro - All Rights Reserved Disclaimer: The above is a matter of opinion provided for general information purposes only and is not intended as investment advice. Information and analysis above are derived from sources and utilising methods believed to be reliable, but we cannot accept responsibility for any losses you may incur as a result of this analysis. Individuals should consult with their personal financial advisors.
© 2005-2022 http://www.MarketOracle.co.uk - The Market Oracle is a FREE Daily Financial Markets Analysis & Forecasting online publication.