


Gold, No Bearish Head and Shoulders Pattern
Commodities / Gold and Silver 2010 Nov 29, 2010 - 05:03 PM GMTBy: Jordan_Roy_Byrne

 In the past week I’ve seen more than a few mentions of the potential head and shoulders pattern in Gold. A head and shoulders pattern occurs when a market forms three peaks and the middle peak is noticeably higher than the left and right peaks. However, that is not enough for the pattern to play out as projected in the textbooks. There are other important characteristics of this pattern, which many technicians ignore or are unaware of.
A real head and shoulders takes months not days or weeks to form. It is a reversal pattern so there is a long period of distribution as the pattern begins its setup. In other words, this pattern occurs at major market tops and bottoms. In a typical market, the pattern occurs only once or twice every ten years.
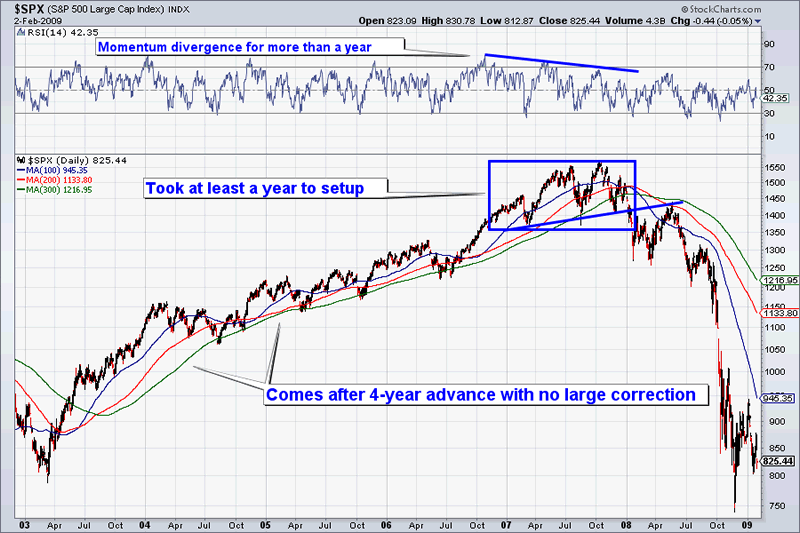
A perfect example is the 2007-2008 top in the S&P 500.
As you can see from the chart below, there are some important characteristics. The pattern takes a while to develop (at least a year), the pattern comes after a long uninterrupted rise and momentum will begin its divergence before you even realize the market is beginning to top.
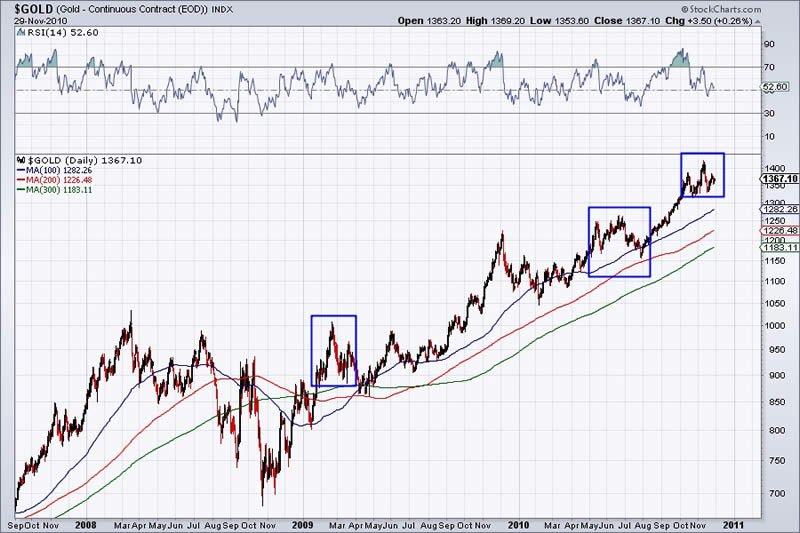
Presently, Gold has no chance of being in a head and shoulders pattern. Momentum just peaked two months ago, the market remains well above the moving averages and most importantly, the market has only been rising in uninterrupted fashion for a little over a year. The market may seem like it could be forming the pattern (as we highlight in the chart) but if it doesn’t fit any of the above characteristics, then there is no need to worry about a reversal.
In fact, in the larger picture, Gold is still in the early stages of a super bullish phase in which it could reach $2,000/oz in the next six to nine months. In past commentaries, we’ve noted how bull markets tend to begin their acceleration around the ninth or tenth year. Note in the chart what happened when Gold broke above channel 2. Even after a strong run to $420 to $500, Gold accelerated to $730. That was a 46% rise in only a few months.
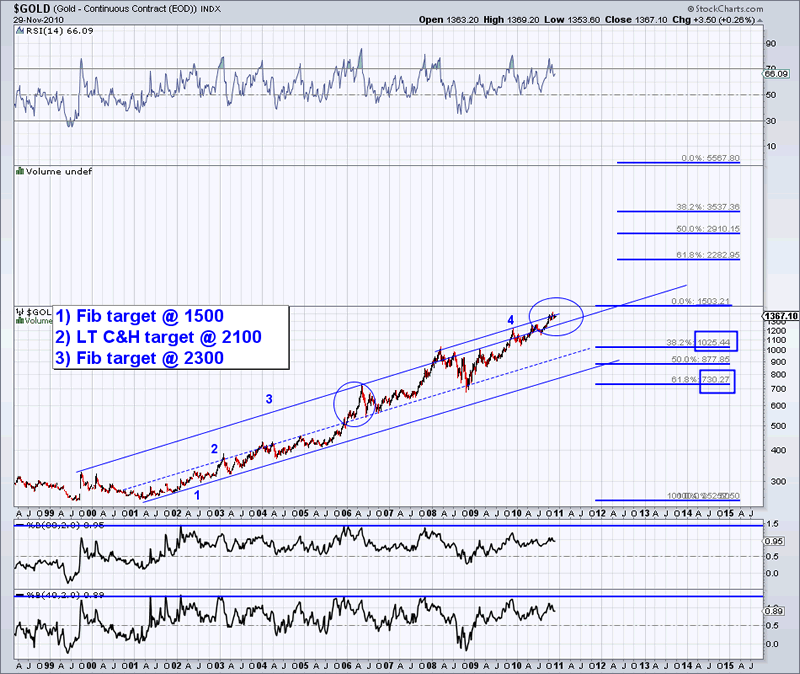
Gold has already broken above channel 3 and only has small resistance left with channel 4. Moreoever, at the bottom of the chart we show the market’s distance from both the 80 and 40-week moving averages. Relative to past peaks, Gold still has room to run. Additionally, since the market is likely entering its most bullish phase, we could see new highs as far as the market’s distance from the 40 and 80 week moving averages.
Of course nothing is certain. We only deal in probabilities and reality. The reality is that Gold is in a major bull market. Its highly probable there is no head and shoulders pattern. Judging from our evidence, there is a good chance that Gold is in an accelerating mode. Sure, Gold could drop $50 or $75. My advice is to leave that to the traders.
The big money will be made in riding this bumpy trend to its zenith. George Soros, Jim Rogers, Warren Buffet and others have made their money by sticking with trends for a very long time. That is why we are sticking with Gold. Yet, in our service we seek to help investors and traders in managing their risk and riding what will be a very bumpy but spectacular bull market. For professional guidance in riding this turbulent but profitable bull market, consider a free-14 day trial to our premium service.
Good luck ahead!
Jordan Roy-Byrne, CMT
Jordan@thedailygold.com
http://www.thedailygold.com/newsletter
Trendsman” is an affiliate member of the Market Technicians Association (MTA) and is enrolled in their CMT Program, which certifies professionals in the field of technical analysis. He will be taking the final exam in Spring 07. Trendsman focuses on technical analysis but analyzes fundamentals and investor psychology in tandem with the charts. He credits his success to an immense love of the markets and an insatiable thirst for knowledge and profits.
© 2005-2022 http://www.MarketOracle.co.uk - The Market Oracle is a FREE Daily Financial Markets Analysis & Forecasting online publication.