Gold and Silver Looking Great Both Technically and Fundamentally
Commodities / Gold and Silver 2010 Dec 06, 2010 - 02:54 AM GMTBy: Clive_Maund

 Things really couldn't look better for gold and silver both fundamentally and technically - and this is said in the knowledge that there are still a lot of naysayers around - if there weren't we really would have cause to be worried. Fundamentally, the major development of recent days that caused markets to soar is the realization that the addled leaders of Europe are set to put aside any principles or laws that stand in the way and backstop the European bond markets, before following the glorious example set by the US and wholeheartedly embracing the instant solution to all problems large and small (apart from insignificant matters like high unemployment) - QE heavy. They are going to step in and support the markets and print as much money as it takes. This is of course great news for the markets - the interests of the elites and of speculators are to be protected at all costs - and the costs will be pushed onto the ordinary guy in the street in the form of roaring inflation.
The recent hiccup in the markets was caused by the crisis in Europe raising the specter of deflation once more and it is kind of ironic that the moment the sense of crisis started to ease, the euro surged against the dollar - ironic because of course the prospect of Europe embracing QE as the solution to its woes ought to send the euro into a tailspin, but as we had anticipated the current euro rally is not due to that, but rather due to near-term relief that the European monetary union is not going to fall apart.
So, now that we can look forward to the printing presses being cranked up with gusto on both sides of the Atlantic, it is hardly surprising that gold and silver - and commodities generally - are starting on the upward path once more, and with such a big green light beckoning ahead, the path is clear for a marked acceleration in the uptrends. After this exhaustive coverage of the fundamentals we will now turn to examine the charts.
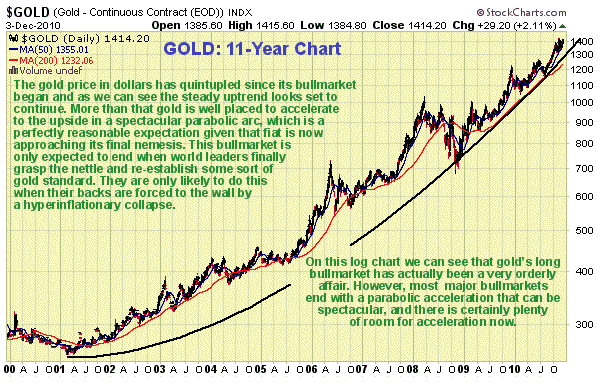
We will start with the long-term chart for gold, in order to remind ourselves of the big picture. The chart shows a strong and steady uptrend - even the violent reaction of 2008 did not take gold below the strong support levele in the $700 area. This chart makes clear that gold is not seriously overbought here and that there is the potential for it to accelerate dramatically to the upside, which is what is expected to happen.

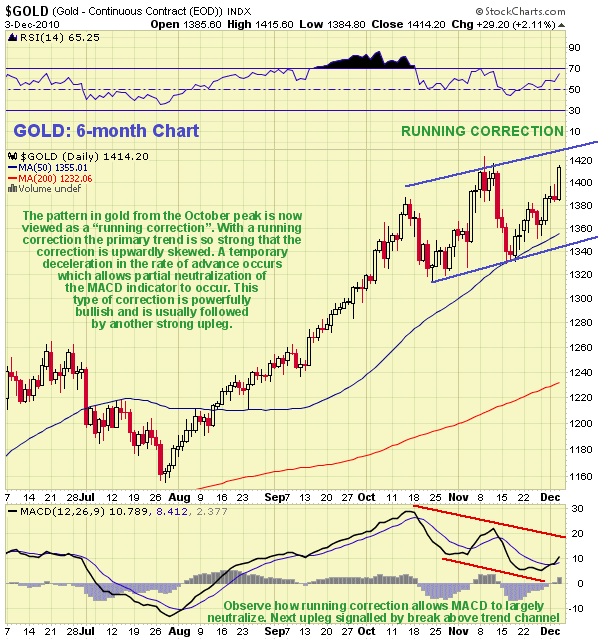
Some observers thought that gold was marking out a Head-and-Shoulders top, with the high of October being the Left Shoulder of the pattern, and the high of November being the Head. However, as we can see on our 6-month chart yesterday's dramatic advance has obviated that possibility. Instead, the action from October appears to have been a strongly bullish "running correction". The reason that it is so bullish is that the primary trend is so strong that a series of higher highs and higher lows develops as the correction unfolds. Gold can be said to have recharged its upside potential "on the fly", which is shown by the substantial neutralization of the MACD indicator shown at the bottom of the chart. Yesterday's powerful move suggests that even though it is already getting short-tem overbought, it is about to accelerate away to the upside again, and this time, given that Europe has "started to see the light", it is likely to be "one for the record books", and with bumbling European bureaucrats forced to close ranks with the US masters of financial engineering, in a concerted drive to crank up the money supply, gold looks set to rise against both the dollar and the euro, as it has been doing, but at an accelerated rate. The attempt to wriggle out of facing the consequences of the massive debt overhang they have created by "kicking the can down the road" by these means will create the danger of an eventual hyperinflationary collapse after a phony recovery. Whatever austerity measures are imposed in the meantime will apply only to the masses - the middle and working classes - and not to banks or government.

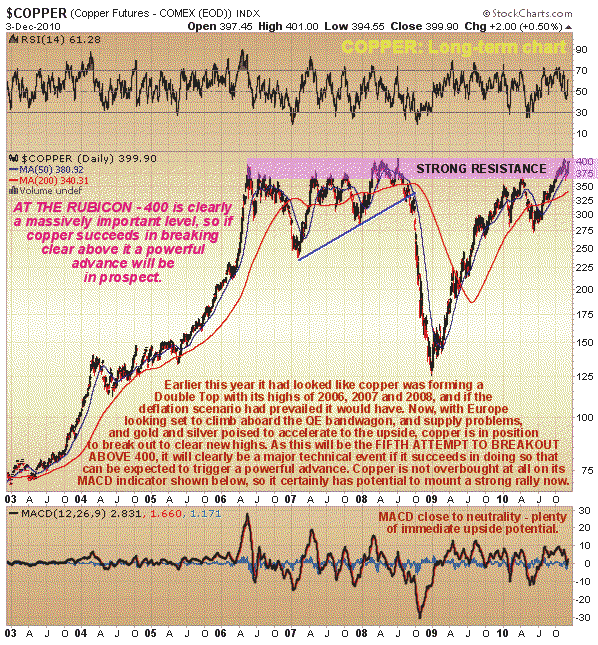
Although this is a Gold Market update, it is worth taking the time for a sideways look at copper here, as it may be on the verge of breaking out to new highs, which if it does should lead to a spectacular ramp, which will have major implications for other commodities and markets generally. On its long-term chart we can see that a huge top formed in copper from 2006 through 2008, which was followed by a dramatic plunge as the 2008 financial crisis hit. It then quickly recovered last year but earlier this year looked like it was forming a huge Double Top with the earlier highs. Now given that it is highly unlikely that copper will turn tail and drop in the near future while gold and silver are forging ahead, and that copper has been banging repeatedly up against the broad strong band of resistance approaching the 400 level no less than 5 times now, it is looks very probable that it will bust through this resistance soon, which would be a major technical event that would be expected to lead to a powerful advance, and with its MACD indicator close to neutrality there is certainly scope for such a move. In the light of these observations it is interesting to learn a mystery trader has captured 80% of London's copper market in recent weeks . The stocks of copper mining companies can be expected to do very well on such a development, which will probably lead to a "phony recovery" phase ahead of possible hyperinflation.

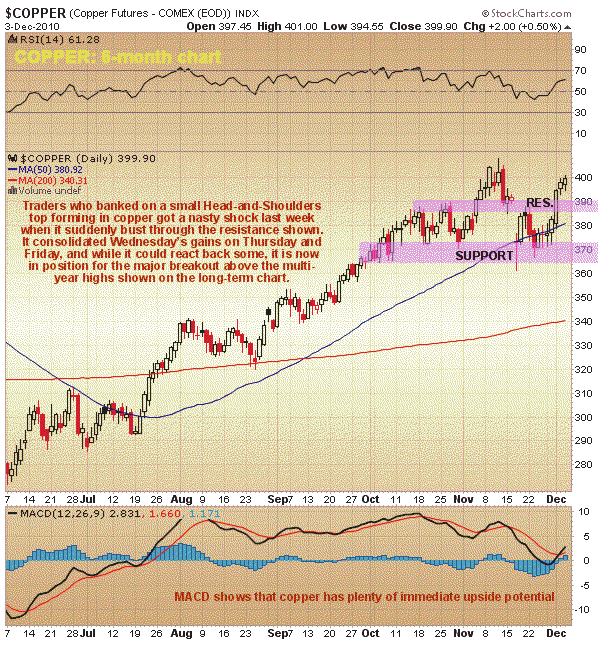
On its 6-month chart we can see that until a few days ago it looked like a Head-and-Shoulders top was forming in copper, but the sharp rally on Wednesday negated that pattern. Although a little overbought short-term copper is now in position for a major breakout.

By Clive Maund
CliveMaund.com
For billing & subscription questions: subscriptions@clivemaund.com
© 2010 Clive Maund - The above represents the opinion and analysis of Mr. Maund, based on data available to him, at the time of writing. Mr. Maunds opinions are his own, and are not a recommendation or an offer to buy or sell securities. No responsibility can be accepted for losses that may result as a consequence of trading on the basis of this analysis.
Mr. Maund is an independent analyst who receives no compensation of any kind from any groups, individuals or corporations mentioned in his reports. As trading and investing in any financial markets may involve serious risk of loss, Mr. Maund recommends that you consult with a qualified investment advisor, one licensed by appropriate regulatory agencies in your legal jurisdiction and do your own due diligence and research when making any kind of a transaction with financial ramifications.
Clive Maund Archive |
© 2005-2022 http://www.MarketOracle.co.uk - The Market Oracle is a FREE Daily Financial Markets Analysis & Forecasting online publication.


