Stock Market 90 Day Cycle Complete, Technical Warnings Signs Brewing!
Stock-Markets / Stock Markets 2010 Dec 07, 2010 - 09:30 AM GMTBy: Jim_Curry
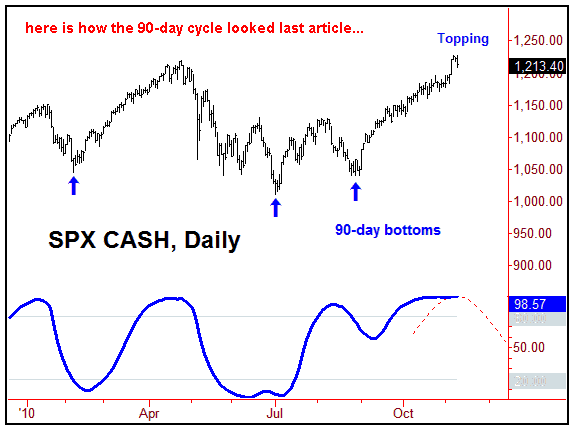
 In a prior article from back in November, I pointed out that the technical indications favored that the 90-day time cycle was in topping range - and was thus due for a short-term peak in the markets. However, that top was not to be made prior to the April high of 1219.80 SPX CASH being taken out to the upside. Below is the chart from that article:

Back in November I noted that this 90-day cycle was likely to give way to the largest-percentage correction seen since coming off the late-August bottom. That is, most of the prior corrections had been in the range of about 2.3% off the top, and with that the coming decline with the 90-day cycle was expected to be greater than this amount.
More specifically, the statistical analysis of the 90-day downward phases in the past had suggested that this correction should be at least 7 trading days off the top - and would ideally decline 4.4% or better before bottoming out. The actual decline with this component ended up lasting exactly 7 days and 4.4% - a direct hit in terms of minimum statistical expectations.

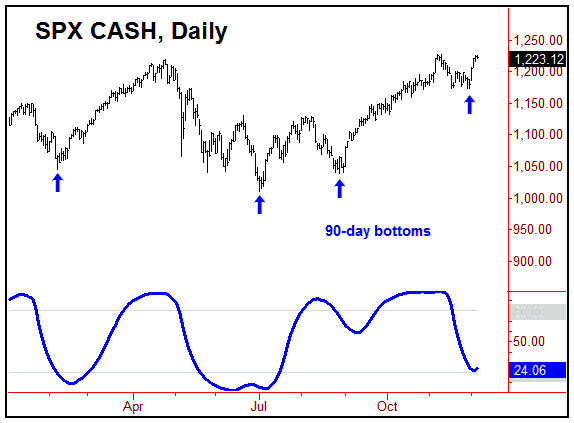
At the time I pointed out that the correction with the 90-day cycle was only to be short-term in nature, as indicators such as the advance/decline line had confirmed the action - and thus were suggesting that any short-term decline would end up being followed by a push to higher highs on the following swing up. Here is how this 90-day cycle chart looks at the present time:
Also noted was a still-outstanding upside target from the 180-day cycle to the 1243.16 - 1286.36 region on the SPX. In other words, following a correction with the 90-day wave (i.e., 4.4% off the top or better), the following upward phase of this cycle was favored to give way to new highs for the larger swing - and, ideally, a move into this 180-day target zone.
What To Expect Now
Right now, the 90-day cycle is deemed to have bottomed at the 1173 level - and thus is pointing higher off the same. Ideally, this means that we are in the upward phase that will top the larger 180-day component, which is now approximately 110 trading days along from it's last bottom - which is the July, 2010 low of 1010.91 SPX CASH.
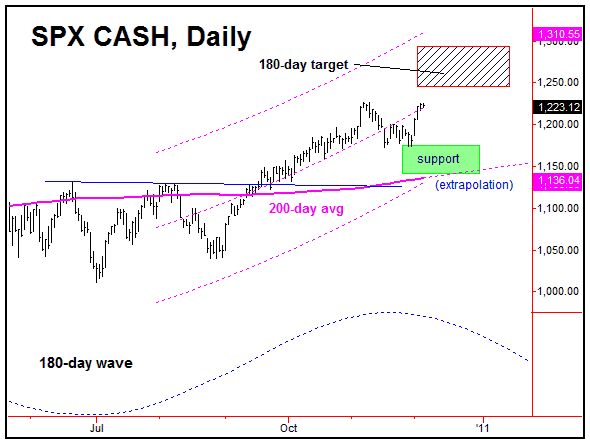
With the above said and noted, the primary focus for mid-term players should be on the 180-day wave, which, as noted above, has a current upside target to 1243.16 - 1286.36 SPX CASH - a target that was originally triggered back in October. This range is not only the upside target for this wave - but is also the favored range to complete the current upward phase of this same cycle. Here is what this 180-day component looks like right now:

In terms of time, the larger 180-day wave is favored to top between now and January of 2011. Traders should bear in mind that this is a large cycle - and thus has a wide average variance of when it could actually form it's peak. Even said, the 1243.16 - 1286.36 range is the favored zone for it to top out, and, if the SPX does move into this area in the days/weeks ahead, traders should be looking at technical indications to either exit (and/or scale-out of) mid-term longs. Alternately, the short side could be attempted - though you should also keep in mind that the larger trend (i.e., with the four-year cycle) is still deemed to be pointing upward for what could be many more months before it peaks!
Technical action
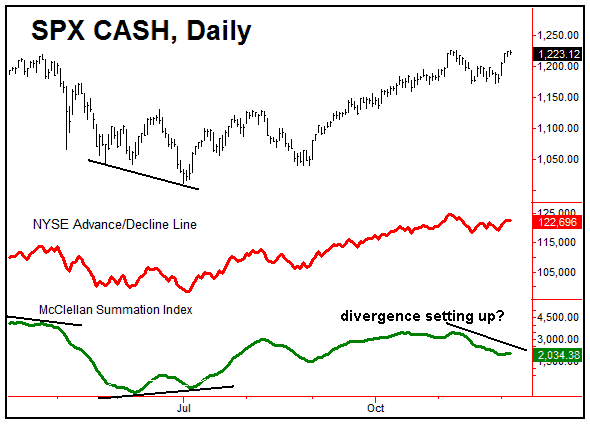
As noted several times in prior articles that I have written, the advance/decline line (chart, below) had yet to register a major divergence between itself and price action - something that we would expect to see on or well before the four-year time cycle actually tops; this has been true about 85% of the time in the past history of this larger cyclic component:

With that, the suggestion from the advance/decline line had been that higher highs for the larger swing would continue to materialize after shorter-term correction phases. That is, traders who are attempting to call a four-year cycle top before the advance/decline line actually diverges are attempting to do something that occurs less than 15% of the time.
Having said and noted the above, there are definite technical warning signs that are currently brewing - at least in regards to the near-term action.
That is, of particular note on the chart above is the action of the McClellan Summation index, which is shown in green. You can see that this particular indicator is going to be hard-pressed to make new highs for the larger swing - even though price is currently within earshot of doing the same.
This is important, as a divergence in the Summation index is normally seen at or near cyclic peaks - with many occurring at larger degree tops, such as with the 180-day cycle. In other words, the market is starting to skate on 'thin ice', at least as far as technicals are concerned. Having said that, it is always possible that normal bullish seasonality could override what the technicals are suggesting.
My basic rule of thumb is that the bigger the divergence in the McClellan Summation index (and/or, the longer that it is present), the larger the following correction will be. Rewind to the July bottom, which saw a good divergence between the Summation index and price at the time; the following rally was 120 points off that bottom into the August high. There was also a divergence at the April top, one that was not as pronounced in the indicator - though it did last a long period of time. It eventually gave way to the correction into the July 1, 2010 bottom.
For the bigger picture then, we have the advance/decline line still in OK shape, though the McClellan Summation index is looking like it is going to show a good divergence from price - a technical negative, if seen as the 180-day target is traded into.
The bottom line with all of the above is this: the SPX should make a move into the 180-day target in the days/weeks ahead. However, the technical indications are starting to suggest internal weakness - which is consistent with what we should expect to see as this larger cycle starts to roll over, ideally occurring some point between now and early-January, 2011. Once this cycle does turn down, then once again we will be set up for the largest percentage correction seen since coming off the late-August low, a correction that is likely to be in the range of 7-10% off the top before bottoming out. More on all of the above as we continue to move forward in the cyclic configuration.
By Jim Curry
Market Turns Advisory
email: jcurry@cycle-wave.com
website: http://cyclewave.homestead.com
Jim Curry is the editor and publisher of Market Turns advisory, which specializes in using cyclical analysis to time the markets. To be added to our mailing list click HERE
Disclaimer - The financial markets are risky. Investing is risky. Past performance does not guarantee future performance. The foregoing has been prepared solely
for informational purposes and is not a solicitation, or an offer to buy or sell any security. Opinions are based on historical research and data believed reliable,
but there is no guarantee that future results will be profitable. The methods used to form opinions are highly probable and as you follow them for some time you
can gain confidence in them. The market can and will do the unexpected, use the sell stops provided to assist in risk avoidance. Not responsible for errors or
omissions. Copyright 1998-2010, Jim Curry
JIm Curry Archive
|
© 2005-2022 http://www.MarketOracle.co.uk - The Market Oracle is a FREE Daily Financial Markets Analysis & Forecasting online publication.


