


Gold Stocks HUI Set for Explosive Bull Run During 2011
Commodities / Gold & Silver Stocks Dec 08, 2010 - 02:10 AM GMTBy: Lorimer_Wilson

 Joseph E. Taglioli writes: We appear to be at the 3rd wave juncture where the large cap producer gold and silver stocks and intermediate precious metals producer/developer stocks tend to start to move much better - and where the smaller explorer class starts to kick up its heels.
Let me show you what I mean with a few charts that will give you a clear visual of why “you ain't seen nothing, yet” when it come to the future performance of the stocks (and warrants) of gold and silver mining and royalty companies.
In the chart below we can see that the HUI (AMEX Gold BUGS (Basket of Unhedged Gold Stocks Index) of 16 large/mid-cap stocks (see here) is continuing to exhibit its fractal relationship compared to late 2005 and compared to the primary fractal in early 2002. The HUI has now broken out and appears to be completing a re-test of the top. It looks like the time for the mark-up phase in the larger cap PM stocks which make up the HUI is upon us. I have marked similar points in the HUI chart to show the similar characteristics to the 2005 period.
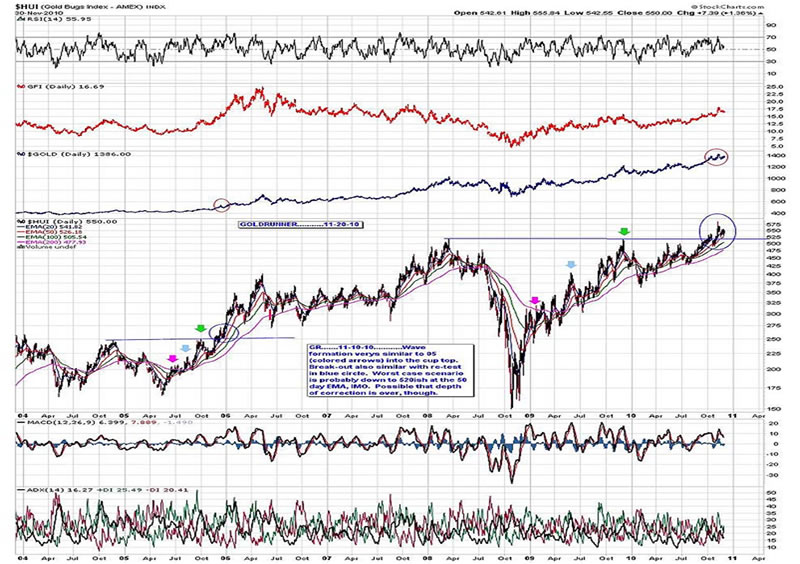
HUI target of 940-970 into May/ June 2011
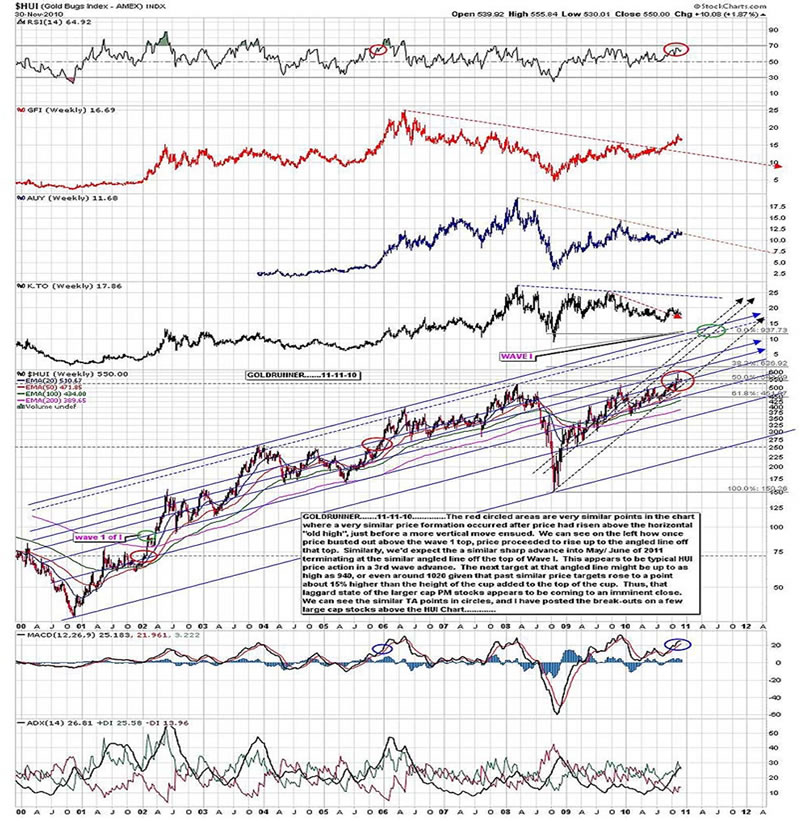
The next chart of the HUI shows the similar price movements and indicators in the primary fractal of wave 3 of I (2002) versus the current 3 of Wave III movements. We can see that at this juncture in the Wave 1 fractal, price rose up to the angled line that extended off of the top of wave 1 of I. Thus, we expect the price rise into May/ June of 2011 to rise up to the angled line off of the top of Wave I. The similar rises in 2002 and 2005 were about 1.18 times (1.16 to 1.18) the height of the cup, added to the top of the cup. Thus, our potential target into May/ June of 2011 for the HUI lies up around 940 to 970. We’ll use the chart as a potential target zone and see how it plays out. Above the HUI chart I have plotted 3 large-cap PM stocks, Gold Fields (GFI), Yamana Gold (AUY) and Kinross Gold (TSE:K, NYSE:KGC), that have underperformed as of late. I’d expect these stocks to perform much better into May/ June of 2011.
Expect An Explosive Rise in HUI Constituent Gold Fields Ltd
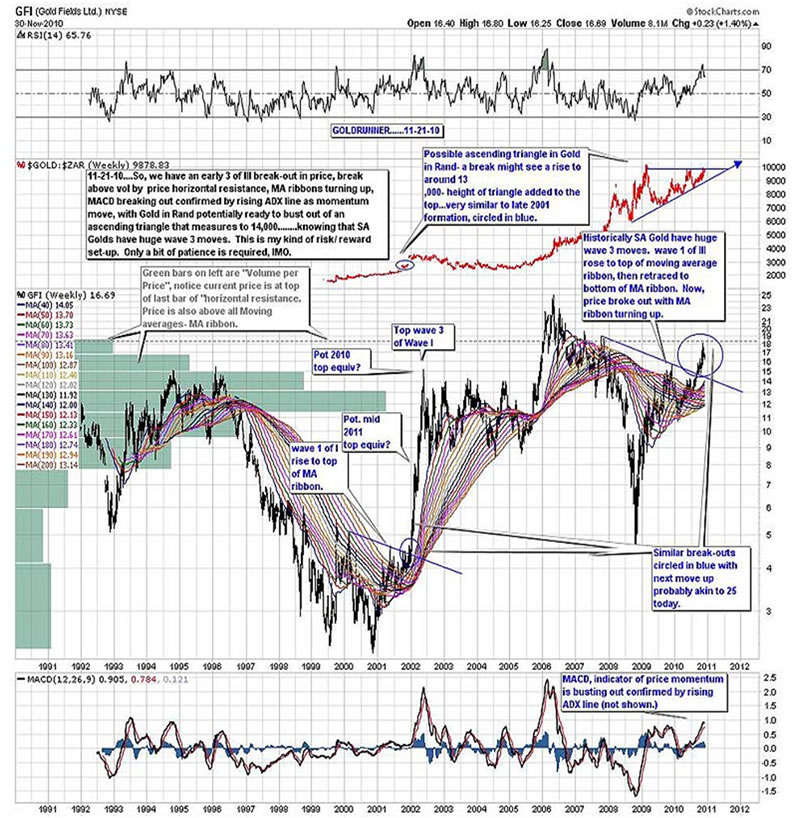
Because few investors actually invest in a PM Stock Index it is necessary to track the progress of the individual stocks that we do invest in while tracking the charts of the HUI helps to give us a better feel of what the sector is doing as a whole. Below, is a chart of Gold Fields Ltd (GFI), a constituent of the HUI, showing the very large cup formation that has developed. We have shown how GFI acted in the 2002 period in a similar cup environment that matches up at one degree lower of Elliott Wave Fractal Degree. We can see in the chart plotted above the GFI chart that Gold in Rand is mired in a triangular correction. If we see a break-out of that triangle in Gold in Rand to the upside we would expect a rather explosive rise in the price of GFI. We have circled on the chart a very similar triangle break higher in Gold in Rand back in late 2001 that powered GFI into the huge 3rd wave rise in Wave I. Historically, South African Gold Stocks have had huge 3rd wave moves relative to the other waves.
Non-HUI Stocks NGD and NSU At Their Sweet Spots
While it looks like the juncture for the large cap stocks (of which the HUI is a proxy) run is close at hand the intermediate producers and soon to be producers are still the sweet spot of investing at this time. As such, we tend to favor stocks like Nevsun Resources (NSU) that should be producing soon and whose chart suggests a potential target of $16 to $18 on this run (from the current $6.50 or so) up to as high as $22, as well as New Gold Inc. (NGD) whose chart suggests a potential target of $22 (from the current $10 or so) up to a possible $28. If the HUI busts out as the charts suggest, we’d expect a higher sloped rise in the intermediate producers along with that HUI rise which in “GR terms” means that I expect NSU and NGD to bust vertically out of the trend channel they are currently rising through.
Explorers Stocks Starting to Run
The explorer stocks are starting to run, and we’d expect them to perform much better into mid 2011. Many of these charts have exhibited a “low chop” rise that is breaking out. The next target for many of these charts will be the “old highs.”
Per the LT fractal back to the 70′s, the PM stocks still might have 90% of their gains ahead of them before this PM Stock Bull is over. We have only reached the top of a mole hill on our trip up the mountain, it seems.
Gold Bullion Has Potential to Rise to $2,250 by mid-2011
A few months, ago, we had outlined a potential range for $Gold to rise into mid- 2011. We placed that range at $1,800 to $2,100 with a mean of around $1,950. There is angled line resistance around $1,875 in that time-frame that might serve as stiff resistance, however…
Conclusion
Gold has the potential to rise up to around $2,250 into mid- 2011 along with the HUI reaching 940-970.
Visit http://www.FinancialArticleSummariesToday.com, “A site/sight for sore eyes and inquisitive minds”, and www.munKNEE.com, “It’s all about MONEY”, where you can sign up for their FREE weekly "Top 100 Stock Market, Asset Ratio & Economic Indicators in Review."
© 2010 Copyright Joseph E. Taglioli, DMD - All Rights Reserved
Disclaimer: The above is a matter of opinion provided for general information purposes only and is not intended as investment advice. Information and analysis above are derived from sources and utilising methods believed to be reliable, but we cannot accept responsibility for any losses you may incur as a result of this analysis. Individuals should consult with their personal financial advisors.
© 2005-2022 http://www.MarketOracle.co.uk - The Market Oracle is a FREE Daily Financial Markets Analysis & Forecasting online publication.