


Is a Correction in Gold Coming?
Commodities / Gold and Silver 2010 Dec 10, 2010 - 11:59 AM GMTBy: J_W_Jones

 In the past few weeks I have made the case that gold might be nearing a correction. I understand that people get defensive regarding gold (no pun intended), but I do not think vulgarities should be expressed towards someone who is pointing out the overbought nature of the daily and weekly charts. It seems any time that I discuss a possible pullback in gold I place a giant target on my back for people to make nasty public comments or send me hateful emails which in some cases I find particularly amusing. To each his own, but something tells me this article will be as well received as an oral reading of the history of the Illuminati at a Christian Christmas celebration.
Before you all rush to berate me for saying gold may go through a mild correction, read this paragraph before you take my work and my name through the proverbial mud . . . AGAIN. Before discussing why gold may go through a short-term correction, I would point out that in the long term I believe gold is in a secular uptrend that could last much longer than many market pundits or traders might prognosticate.
I do not hold myself out to be an economist, but it appears to me that there are several catalysts looking towards the future that likely will give gold a boost. Unfortunately, the reasons gold could continue rallying are not economically pleasant and certainly not exciting to discuss as by now they have been beaten into our psyches. Instead of pounding the table about all of the various reasons investors should own gold, I am going to focus on a potential opportunity to buy gold at lower prices.
Based on a variety of technical indicators and analysis paired with some fundamental opinions, a trader could make the case that gold is in need of a downward price correction. Gold has been purchased with strong volume for more than a year as a result of several reasons. When looking at a weekly chart of the gold ETF GLD it becomes apparent that the shiny metal is overbought and in need of a pullback, or at a minimum some healthy consolidation.
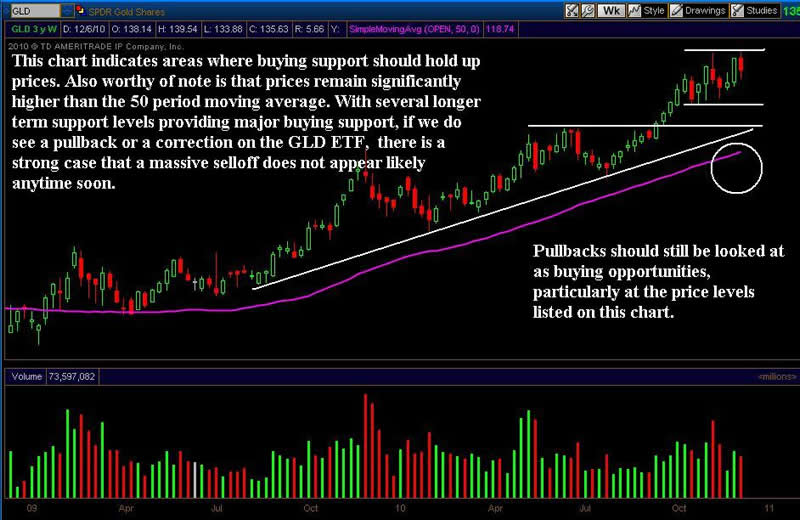
As can be seen above, gold remains in a strong uptrend and price is well above the 50 period moving average. In fact, the 50 period moving average on the weekly GLD chart has not been tested since April of 2009. The long term trend remains bullish, but as stated above stated above not needed here a pullback is possible.
If we take a look at the GLD daily chart we notice the same long term uptrend that that is needless here we witnessed when looking at the weekly chart. In contrast the daily chart does show potentially bearish formations beginning to work. While the bearish formations patterns, too close previous use of formations may fail or may turn out to be totally false why totally, just use false, it is strong enough on its own based on future price action, at this point a double top formation is possible as is a head and shoulders pattern. This is not to say that GLD cannot grind higher because the weekly chart looks quite strong, but the daily chart is at least posting a warning that lower prices or at least a period of consolidation may be coming to fruition in the not-so-distant future.
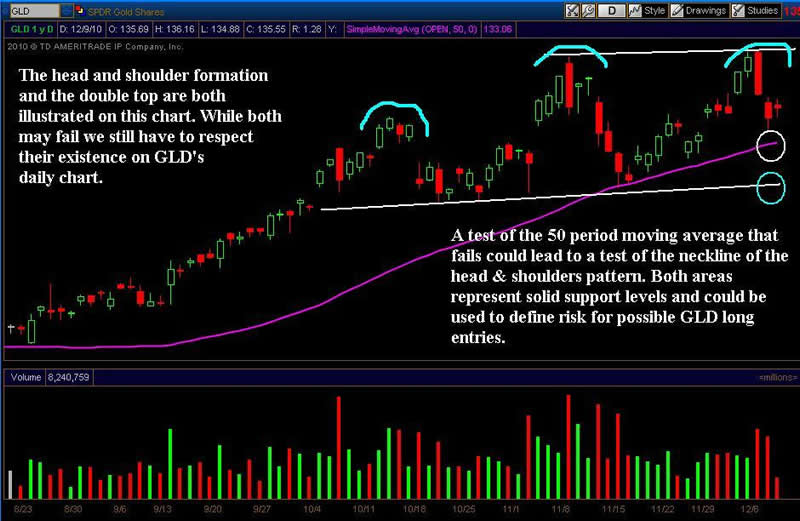
While I am expecting a meaningful pullback or correction at some point, I do not believe that gold is going to crash lower. In fact, I am viewing the possible correction in gold as an excellent potential long entry. Clearly traders could look to purchase GLD around the 50 period moving average on the daily chart ($133.06) and then add to the position if the neckline is tested. I do not believe that price will get to the neckline, but if it does I expect that level to hold and a new rally to take shape. Until gold gets below the 50 period moving average on the weekly chart, it remains in a technically constructive uptrend.
There are a variety of ways to purchase GLD if an equity trader wanted to leg into the trade at a variety of price targets. One strategy would be to simply accumulate partial positions at predetermined price targets. When considering entering a longer term position, investors and traders should formulate a plan and then trade that plan. Through the use of a trading plan, the trader can remove emotion from the subsequent purchase(s) while managing risk.
For those who would like to use options to acquire GLD common stock, the easiest strategy would be to sell cash secured naked puts. Secured naked puts do not require significant option trading experience and most option brokers will allow relatively inexperienced option traders to use this strategy. Each option contract represents 100 shares of GLD, so the trader sets aside a portion of his trading capital to purchase 100 shares of the underlying.
As a basic example, if a trader sold a cash secured January 133 put the trader would be required to have the appropriate cash in the account to purchase 100 shares of GLD at $133/share. So in order to have the put totally secured, the trader in this example would need $13,300 to fulfill the required capital obligation. For a more speculative trader that was looking to collect option premium based solely on time decay (Theta) and had no intention of owning common stock, margin encumbrance would be required. Most option brokers will demand that option traders be able to post 15-20% of the total obligation (Reg T) and will allow more experienced option traders to use margin in order to cover the remaining portion. Traders using portfolio margin can use this strategy to add income to their portfolio without tying up a significant portion of their trading capital.
Based on the weekly chart listed above, the target support areas are around $133/share and $130/share respectively. We will assume the trader wanted to purchase 100 shares at each price point. The trader in this example could sell 1 GLD January 133 Put and 1 GLD January 130 Put. Based on current prices, the trader would receive a credit of $235 for the GLD January 133 Put and a credit of $139 for the GLD January 130 put. Total credit on this trade would be around $374 not including commissions. If GLD does not sell off and continues to rally, the trader has the potential to collect a large portion of option premium from the two cash secured puts that he sold. In this case, the maximum gain would be the total credit received of $374 at expiration if the trader did not get assigned GLD common stock.
It is critically important to understand that there is significant risk in this trade as the theoretical loss would be over $26,000 assuming that GLD were to go to 0 and the trader did not close out the position. Clearly gold is not likely to be worthless, and the odds of losing $26,000 are slim to none however it is theoretically possible. If the trader in the example gets assigned the stock he still gets to keep the option premium for which he sold the puts for which was $374. Since he was purchasing 200 shares of GLD, his total cost would be reduced by $1.87 a share (374 / 200 = 1.87). The average price he would pay for 200 shares of stock would be $131.50/share (133+130 / 2 = 131.50), thus his actual price per share would be $129.63 (131.50 – 1.87 = 129.63).
The profit engine for the naked puts is time decay (Theta). Volatility and price risk exist and would become reality if a massive overnight sell off in gold took place. However, if the trade operated as is custom in traditional market conditions the option trader in this case either will earn a portion or potentially all of the premium he received for selling the puts or he will be assigned 200 shares of GLD with a total basis of $129.63. If the trader wishes to own 200 shares of GLD and has the capital to purchase the common stock, this is an excellent way to develop a trading plan that takes advantage of support levels and remains profitable if GLD continues higher.
If you would like to continue learning about the hidden potential options trading can provide please join my FREE Newsletter: www.OptionsTradingSignals.com
J.W. Jones is an independent options trader using multiple forms of analysis to guide his option trading strategies. Jones has an extensive background in portfolio analysis and analytics as well as risk analysis. J.W. strives to reach traders that are missing opportunities trading options and commits to writing content which is not only educational, but entertaining as well. Regular readers will develop the knowledge and skills to trade options competently over time. Jones focuses on writing spreads in situations where risk is clearly defined and high potential returns can be realized.
This article is intended solely for information purposes. The opinions are those of the author only. Please conduct further research and consult your financial advisor before making any investment/trading decision. No responsibility can be accepted for losses that may result as a consequence of trading on the basis of this analysis.
© 2005-2022 http://www.MarketOracle.co.uk - The Market Oracle is a FREE Daily Financial Markets Analysis & Forecasting online publication.