Stock Market Indices Close Mixed in Last Hour Sell-Off
Stock-Markets / Stock Markets 2010 Dec 14, 2010 - 03:01 AM GMTBy: Harry_Boxer
 The stock market indices ended mixed on the session after a last-hour sharp sell-off peeled back a vast majority of the gains and closed the indices right at the lows for the day.
The day started out with a gap up. They then backed and filled, held support, and went to new highs the entire rally, reaching 2225 on the Nasdaq 100 and nearly 1247 on the S&P 500.
The rest of the day was spent consolidating, but in the last hour when they failed to break out to the upside, they rolled over hard and sharply, taking the NDX from 2225 down to 2207, closing negative on the session.
Net on the day, the Dow dropped back about 60 points, closing up just 18.24 at 11,438.47. The S&P 500 was up 0.06 at 1240.46, nearly 7 points off its high, and the NDX closed down 7.89 at 2207.45.
Advance-declines were 16 to 14 negative on the New York Stock Exchange and about 3 to 2 negative on Nasdaq. Up/down volume was 5 to 4 positive on New York with only 950 million shares traded. Nasdaq traded 1.84 billion, but had a 2 1/2 to 1 negative ratio of declining volume over advancing volume.
So, Nasdaq was decidedly negative today, and that was led by a lot of large-cap stocks that had multiple-point losses today, particularly on the Nasdaq 100.
Charts of the Day:
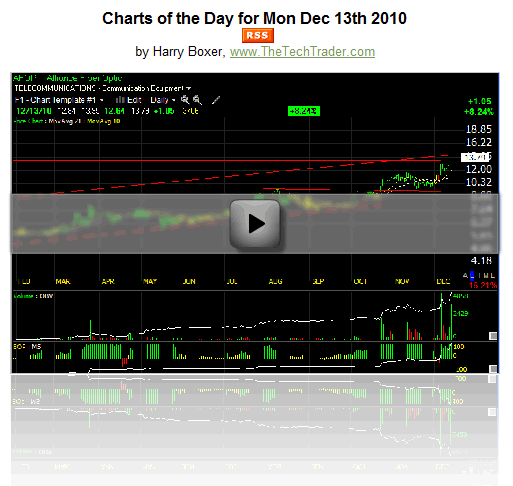
Today's longs include AFOP, CGNX, EXEL, GGC, GMXR, GORO, LOCM, LOJN, MCP, MGIC, MIPS, SHZ, SIGM, and SNCR. Shorts include BIG, CELG, CMG, FSYS, GSIC, HMIN and MICC.
Reviewing our Watchboard:
TheTechTrader.com board, however, still had quite a few gainers today. Leading the way on our board was Molycorp, Inc. (MCP), up 3.00 to 34.28. Synchronoss Technologies, Inc. (SNCR) advanced 2.18 to 29.57, Cognex Corp. (CGNX) 1.42 to 30.44, and Magic Software Enterprises Ltd. (MGIC) 1.08 to 7.88.
Other gainers of note included Alliance Fiber Optic Products Inc. (AFOP) up 1.05 to 13.79. L & L Energy, Inc. (LLEN) snapped back 1.07 to 11.84, China MediaExpress Holdings, Inc. (CCME) jumped 1.14 to 16.66, Goodrich Petroleum Corp. (GDP) 87 cents to 17.30, Ebix Inc. (EBIX) 92 cents to 23.38, and JDS Uniphase Corporation (JDSU) 43 cents to 13.86.
In addition, China Shen Zhou Mining & Resources, Inc. (SHZ) rose 72 cents to 4.50, a big percentage gain there. Orexigen Therapeutics, Inc. (OREX) was up 61 cents to 9.02, MIPS Technologies Inc. (MIPS) 90 cents to 15.97, and Cost Plus Inc. (CPWM) 60 cents to 10.90.
On the downside, point-plus losers included E-Commerce China Dangdang Inc. (DANG) down 3.64 to 29.15, OmniVision Technologies Inc. (OVTI) 1.10 to 31.53 on a downgrade, Motricity, Inc. (MOTR) down 1.21 to 22.34, Coinstar Inc. (CSTR) down 2.55 to 64.07, Cree Inc. (CREE) 1.53 to 70.52, and Amazon.com Inc. (AMZN) 1.37 to 174.25.
There were many other large-cap stocks that took it on the chin and negatively impacted Nasdaq 100. One of these was Netflix, Inc. (NFLX), down 10.83 to 183.80.
Stepping back and reviewing the hourly chart patterns, the indices were basically up early, flat midday, and then rolled over hard into the afternoon, closing at the lows for the day. Not a very good way to start the week, indeed, but support is still holding here.
We'll see if there's any downside follow-through tomorrow.
Good Trading!
Harry
For more of Harry Boxer, sign up for a FREE 15-Day Trial to his Real-Time Technical Trading Diary. Or sign up for a Free 30-Day Trial to his Top Charts of the Week service.
(c) 2010 AdviceTrade, Inc. All rights reserved. Distributed only by written permission of AdviceTrade and The Technical Trader at info@advicetrade.com . In using any portion of Harry Boxer's content, you agree to the terms and conditions governing the use of the service as described in our disclaimer at http://www.thetechtrader.com
Mr. Boxer's commentaries and index analysis represent his own opinions and should not be relied upon for purposes of effecting securities transactions or other investing strategies, nor should they be construed as an offer or solicitation of an offer to sell or buy any security. You should not interpret Mr. Boxer's opinions as constituting investment advice. Trades mentioned on the site are hypothetical, not actual, positions.
Harry Boxer Archive |
© 2005-2022 http://www.MarketOracle.co.uk - The Market Oracle is a FREE Daily Financial Markets Analysis & Forecasting online publication.


