


The Inverse U.S. Dollar Relationship, SPX and Fear
Stock-Markets / Financial Markets 2010 Dec 16, 2010 - 05:07 AM GMTBy: Chris_Vermeulen
 So far this week we have been seeing fear creep in the equities market. This Wednesday we started to see fear (green indicator) reach a level which tells me to start looking for the market to bottoming. I do follow a few other charts and indicators which warn me of a possible trend reversal (high probability setup) before it takes place but the US Dollar and selling volume are key.
As we all know, when the market is trying to top and roll over it tends to be more of a process than a couple day event. It’s this lengthy topping process which has a lot of choppy price action which sucks traders into a position much to early or shakes you out of the position before the market does what you anticipated.
On the flip side, bottoming is more of an event because it tends to happen after a strong wave of panic selling. Fear is the most powerful force in the market (other than the Fed/Manipulators.. but that’s another topic). That being said, when you know what to look for in bottoms you can generally see the market starting to bottom and prepare for it.
The charts below of the US Dollar Index and the SPY clearly show the inverse relationship they have. Right now it seems everything is directly connected with the dollar… it has been like that for most if the year… I will note that its not normally this clear. Anyways, the dollar is currently trading at resistance which means there is a good chance it will turn back down. So if the dollar drops, then it should boost the SPY (equities market) and put in a bottom for stocks.
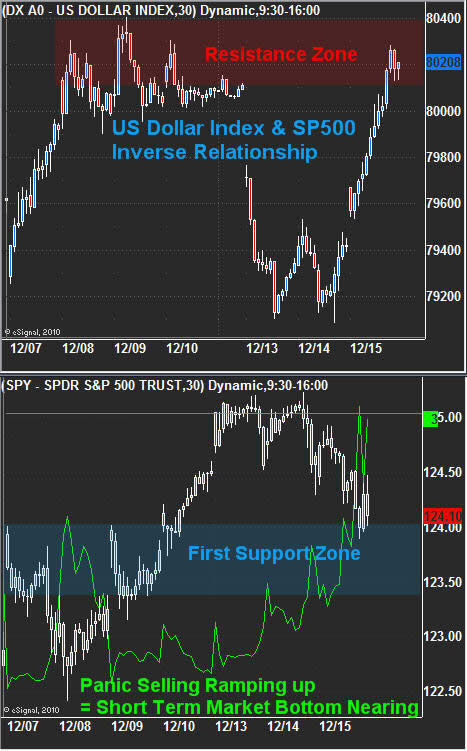
Looking at the lower chart of the SPY etf you can see that recent prices have dropped down to a support zone. The important thing to note here is how selling volume is ramping up. This to me means more traders are getting worried and are cutting their losses or locking in gains before it gets worse. We typically see panic selling enter the market near the end of pullbacks. Just like in a bull market where the retail trader (John Doe) is the last to buy before the market falls, it’s the same but flipped in a down trend. The retail trader is the last to panic and sell out of their position before the market bounces/rallies.
Currently the equities market looks to be showing signs that a bottom is nearing. Over the next session or two the rest of this equation should come to light as a tradable bottom or to start playing the down side of the market, only time will tell…
I’d like you to have my ETF Trade Alerts for Low Risk Setups! Get them here: http://www.thegoldandoilguy.com/specialoffer/signup.html
Also Follow Me on Twitter in Real-Time: http://twitter.com/GoldAndOilGuy
By Chris Vermeulen
Chris@TheGoldAndOilGuy.com
Please visit my website for more information. http://www.TheGoldAndOilGuy.com
Chris Vermeulen is Founder of the popular trading site TheGoldAndOilGuy.com. There he shares his highly successful, low-risk trading method. For 6 years Chris has been a leader in teaching others to skillfully trade in gold, oil, and silver in both bull and bear markets. Subscribers to his service depend on Chris' uniquely consistent investment opportunities that carry exceptionally low risk and high return.
This article is intended solely for information purposes. The opinions are those of the author only. Please conduct further research and consult your financial advisor before making any investment/trading decision. No responsibility can be accepted for losses that may result as a consequence of trading on the basis of this analysis.
Chris Vermeulen Archive |
© 2005-2022 http://www.MarketOracle.co.uk - The Market Oracle is a FREE Daily Financial Markets Analysis & Forecasting online publication.