Stock Market Elliott Wave Trend Forecast 2011
Stock-Markets / Stock Markets 2011 Dec 21, 2010 - 04:21 AM GMTBy: Joseph_Russo
 In this critical year-end forecast we shall pinpoint the following:
- The precise degree of trend in which the Dow currently trades
- The size and scope of the current wave at Supercycle degree
- Where the Dow stands within its current primary bull market advance
- Where the Dow and general share prices may be heading in 2011 and beyond
- The precise path broad market indices may take during the course of IV down
- Exactly how traders and investors should engage the markets going forward
Before we proceed, we’ll wrap up our introduction by taking a step back in time for a quick visual review of the dead-on accuracy that our forecasts have produced over the past year.
10 Months Ago:
The three historical reference charts below were observed regularly in our Near Term Outlook publication. Much earlier this year, way back on March 11 of 2010, we provided a rather detailed graphic forecast as to the projected price path for the Dow Jones Industrial average.
In early 2010, take note that we had illustrated a prospective top to an intermediate (a) wave terminal that was slated to occur in April above the 11,000 level. From there we also projected a plausible price path (purple) which illustrated that following a peak in April, the Dow was then expected to experience a sharp correction toward the 9500 level into July of 2010.
Thereafter, our price path projections had also anticipated an equally sharp rebound recovery, which suggested that the Dow would then launch higher through December, registering a higher high beyond that which was imminently forecasted to occur in April.
More the exception than the rule, the medium range forecast we had presented back in March of 2010 was absolutely perfect. We called for a high in April, then a low in July, followed by a forecast for higher highs in December; and the Dow has followed our price path and general amplitude projections to a tee.
The three charts that follow illustrate two dead-on outcomes as price and time unfolded. If the Dow registers another key pivot high this December, we can then boast three dead-on outcomes. Until then, the jury remains out on a December 2010 key pivot high.
Charting and forecasting the market
The first chart below is the original that was presented to clients on March 11, 2010. Note that an alternate count is shown in light blue. Could we have made it any clearer as to what our expectations were over the near and medium term?
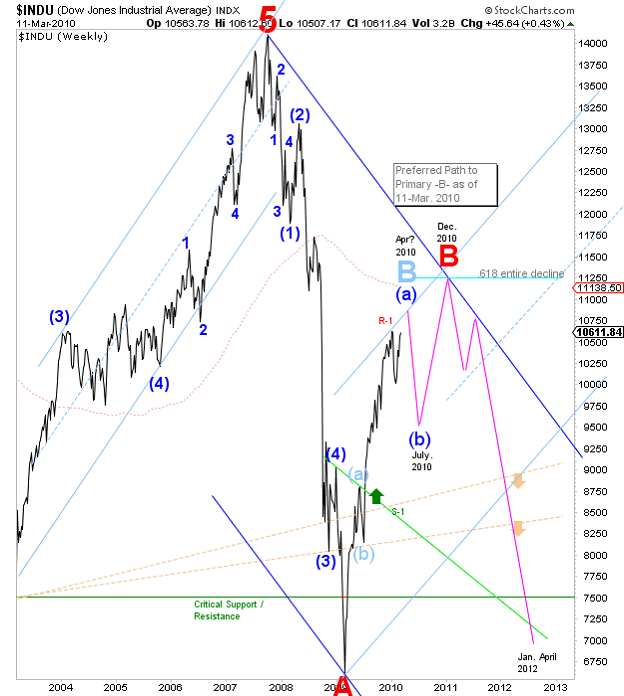
DEAD-ON Outcome #1: Key pivot high registers in April
Below, in the second of three historical reference charts, take note of the precision in which the Dow followed our standing price projections for a near term top in April. Secondly, take note of the sharp decline occurring in May and June, which brought the Dow down toward the 9500 level in July, exactly as we had projected.
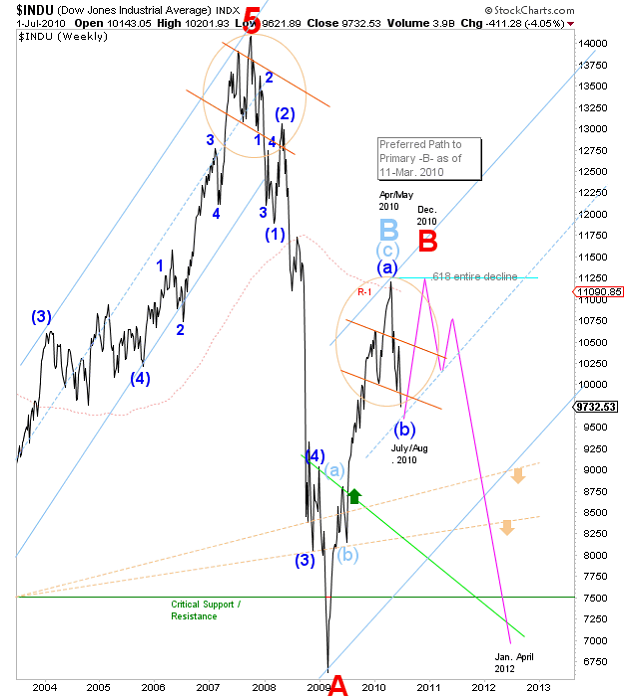
DEAD-ON Outcome #2: Key pivot low registers in July / Higher, highs in December
Below, in the last of our three historical reference charts, take note of the precision in which the Dow followed our standing price projections for a sharp recovery rally off the July low, validating our long standing forecast for higher highs into the year ending 2010.
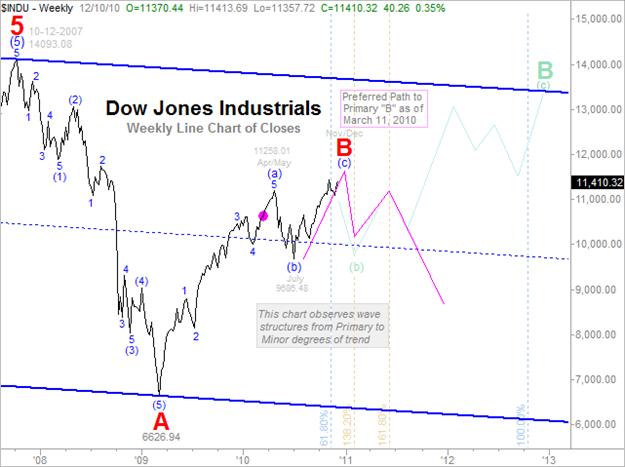
Side note: As you can see by the size and layout of the last introduction chart above, we have recently adopted using our proprietary trading platform charts to produce screen cast publications for subscribers. This aside is significant relative to automated systems trading dynamics, which we shall touch on later in this article.
With our predominantly visual introduction out the way, we shall now proceed in laying out the case for:
- The precise degree of trend in which the Dow currently trades
- The size and scope of the current wave at Supercycle degree
- Where the Dow stands within its current primary bull market advance
- Where the Dow may be heading in 2011 and beyond
- The precise path the Dow may take during the course of IV down
- Exactly how traders and investors should engage the markets going forward
Fibonacci Turn Periods | Elliott Wave Terminals | Trading Systems
The tools employed for the following market forecasts have spawned from the works of Leonardo Fibonacci, and Ralph Nelson Elliott. Developed by the author, associated trading systems built upon the underlying tenets of these tools eliminates the "what-if" emotionally biased guesswork from the near impossible task of knowing which forecast (if any) will ultimately prove correct.
Leonardo Pisano Bigollo (c. 1170 – c. 1250)[1] also known as Leonardo of Pisa, Leonardo Pisano, Leonardo Bonacci, Leonardo Fibonacci, or, most commonly, simply Fibonacci, was an Italian mathematician, considered by some "the most talented western mathematician of the Middle Ages."[2]
Fibonacci is best known to the modern world for [3] the spreading of the Hindu-Arabic numeral system in Europe, primarily through the publication in the early 13th century of his Book of Calculation, the Liber Abaci; and for a number sequence named after him known as the Fibonacci numbers, which he did not discover but used as an example in the Liber Abaci.[4]
Ralph Nelson Elliott (28 July 1871–15 January 1948) was an American accountant and author, whose study of stock market data led him to develop the Wave Principle, a form of technical analysis that identifies trends in the financial markets. He proposed that market prices unfold in specific patterns, which practitioners today call Elliott waves.[1]
What exactly can we hope to accomplish using the tools provided by Leonardo and Ralph?
Frame, Structure, Vision
As clearly demonstrated with our trio of introductory charts above, if applied properly and with diligence, the effective use of Elliott Wave in concert with elements of the Fibonacci series can produce astoundingly accurate forecasts. Simply put, the combined tools of Elliott and Fibonacci can provide a framework, structure, and vision like no other form of applied technical analysis.
What should we NOT expect from these brilliant and exquisite forecasting tools?
A precise roadmap set in stone | An effective way to trade and profit
When it comes to forecasts like those presented in this article, one should never come to expect the type of precision archived nor rely upon such in the future to trade/invest their hard-earned speculative capital. Despite the incredible power behind the tools employed, real time price action can and will change forecast dynamics as time and price unfold. More importantly, due their varied and subjective dynamics, neither of these exceptional analytical tools can be relied upon as a standalone means by which to trade or time investments.
So, when is this rally off the 2009 bear market low going to end? How high will the Dow climb before another bear market takes hold? What wave and degree of trend are we in? If we are indeed in a secular bear market, how long might it last? If we are still in the middle of a longer-term decline, will there be more bull markets within the larger construct of the secular bear market? What will this Supercycle-IV wave look like?
To answer the above questions in short:
- The current rally may end in December of 2010. Whether or not terminal to the current rally marks the end of the entire primary bull market is quite another story.
- The Dow is in a IV wave down at Supercycle Dimension
- Contingent upon its path, the Supercycle IV wave can last until 2020 or 2030
- Yes, there will be many more bull and bear markets within the current Supercycle
Okay then, let's narrow our forecasts down to just three of the many nonlinear outcomes that may manifest over the next two decades. First, we must start by identifying at least three potential prospects for citing the most plausible Elliott wave terminals associated with the current bull market advance from the 2008-2009 bear market lows.
Secondly and by default, each of the imminent Elliott wave terminals proposed shall then contain subsequent waves relative to their respective degrees of trend.
Lastly, for general timing purposes, we'll correlate high probability Fibonacci turn-years from those which have proven to be exceptionally accurate over the past 90-years.
To get a good visual comparison, we’ll first show you what each of our three forecasts looks like, and then we’ll go back and discuss each of them individually. Here they are.
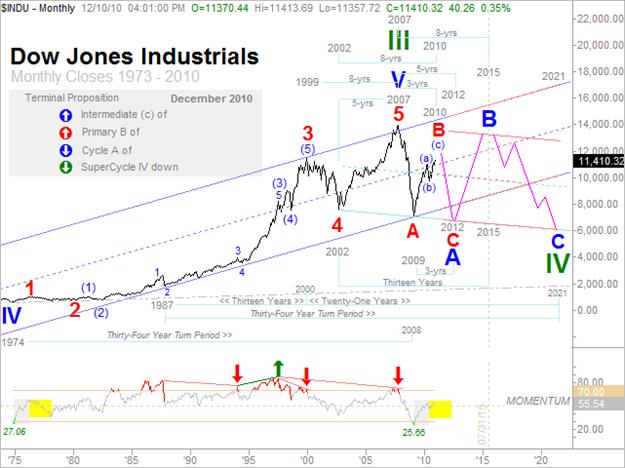
Forecast One: where we are currently in (a) of B of A of IV down
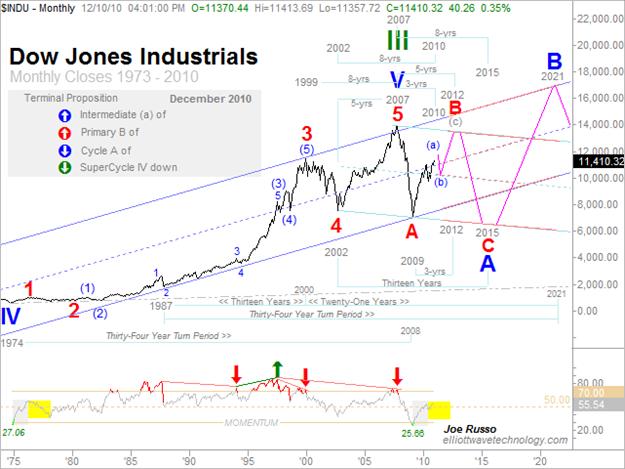
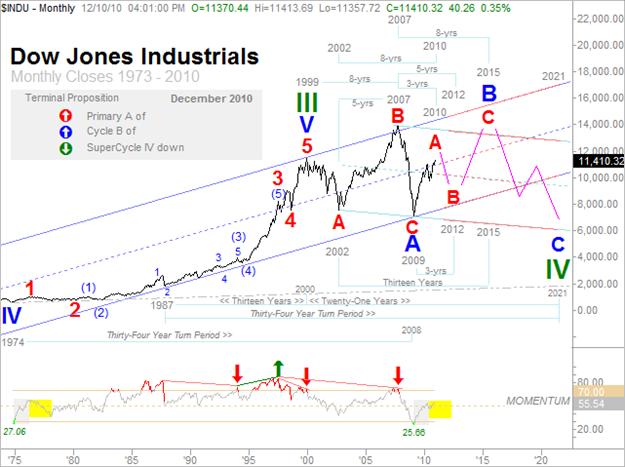
Forecast Two: where we are currently in B of A of IV down
Forecast Three: where we are currently in A of B of IV down
Now that you have comparative snapshots of all three forecasts, let’s quickly review each of them one by one. But first, let’s briefly discuss what each of the charts share in common.
Fibonacci Turn-Years
Common to each of the charts are fixed Fibonacci turn-year markers. We have labeled past, present, and future locations of turn years using light blue colored lines. For example, at the lower left hand corner of the chart we see the cycle degree IV wave terminal basing in 1974. We have labeled 1974 as the start of a plausible Fibonacci turn sequence. The horizontal line drawn from 1974 to 2008 represents a thirty-four period (low-low) Fibonacci turn year projection. If we do the very same thing from the 1987 low, it’s correlating 34-year turn period arrives in 2021. Whether 2021 marks a low-low or low-high turn is not discernable, only the general timeframe for a turn pivot may be extrapolated from this type of sequencing.
Just think if back in 1974 someone had told you that in the year 2008 there will be a significant turning point in the stock market. You would have thought they were mad. But low and behold, just three months following the end of 2008, a major turning point for the stock market was indeed established. Not bad for a general forecast made some 34-years in advance.
We have identified other Fibonacci time relationships in the same fashion from various price terminals that we consider to be viable starting points from which to initiate a turn sequence. We have used the 3, 5, 8, 13, 21, and 34 intervals in varying instances. Another example would be the 5-year turn period from the 2002 low, which ran up the Dow to its 2007 all-time-high. Each of the time studies is fixed across all three forecasts presented. Okay, now let’s take a closer look at our first forecast.
2010, Terminal Proposition 1: Forecast One: where we are currently in (a) of B of A of IV
Be careful not to confuse this prospective wave count with the one presented earlier in our introduction. In this study, we have still yet to complete the intermediate (a) wave up, which we may be in the process of doing right here, in December 2010.
Most interesting in this plausible wave count is that following a corrective decline to (b) in 2011, the projected price path going forward points to a retest or possible fresh historic high into the 2012 Fibonacci turn period. Such a high would mark terminal to wave (c) of Primary B, and complete the entire bull market advance off of the 2009 print low.
We find this count particularly interesting because it sits in direct contrast to the widespread anticipation of ensuing catastrophe surrounding the arrival of the Mayan Calendar phenomenon slated to take place on December 21, 2012.
On December 21, 2012 the Sun will eclipse the center of the Milky Way Galaxy. It is also the winter Solstice, which places the Earth between the Moon and the Sun. This alignment only happens once every 26 thousand years or so. That is why the Mayans point it out as the end of a cycle. It is a very large, galactic cycle - one that will begin again on December 22, 2012 and last another 26 thousand years.
Will markets run up to this widely known event, manifesting a peak in stock prices in the same way that the markets ramped up into the Y2K event in 1999-2000? Next, we’ll look at proposition 2.
2010, Terminal Proposition 2
Forecast Two: where we are currently in B of A of IV
This is the wave count presented in the introduction. Here we show the 2010 July low as having based the intermediate (b) wave, and the current rally into December 2010 as wave (c) of primary B. Of all three of our most plausible counts, this is by far the most imminently bearish.
We also find this count interesting from the perspective of the pending Mayan phenomenon. Here, anticipated fears would be satisfied as the Dow retests or breaches beneath its 2009 bear market lows. The catch here is that as soon as everyone realizes that the world is not coming to an end; the larger A wave at cycle degree will bottom, setting the Dow free to embark upon a massive three year bull market run into the 2015 turn period.
Note that 2012 marks 3-yrs from the 2009 low, 5-yrs from the 2007 high, and 13-yrs from the Y2K high in 1999. Moreover, note that 2015 shall mark 8-yrs from the 2007 high, and 13-yrs from the 2002 low.
Given our long standing conviction that the 1932 crash low marked the II wave at Supercycle degree, we can then conclude that contingent upon where we place its terminal (1999 or 2007), Supercycle III has lasted anywhere from 67-75 years. This strongly suggests that a corresponding IV wave of Supercycle dimension should last for at least 1/3rd the amount of time of its preceding bullish advance.
As such, we can expect IV down to last at least 20-22 years. If counted from a Supercycle III wave crest in 2007, wave IV down can base anytime between 2027 and 2029. If the largest III wave is counted from the 1999 crest, Supercycle IV can base anytime between 2019 and 2021. Next, we’ll look at our last plausible forecast.
2010, Terminal Proposition 3:
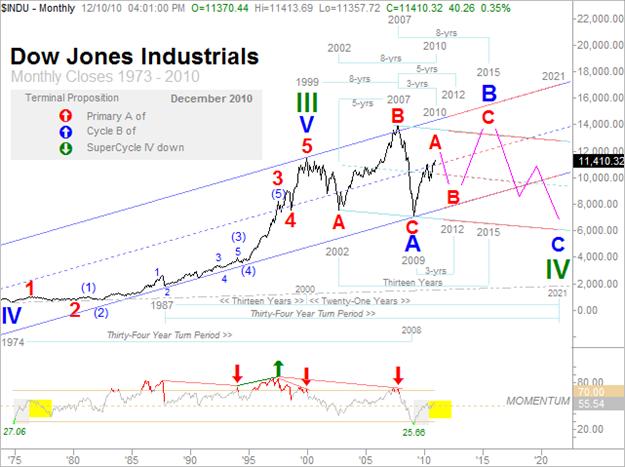
Forecast Three: where we are currently in A of B of IV
In the last of our immediate and longer-term forecasts we have positioned the top of Supercycle III at the earlier 1999 crest. Doing so repositions the all-time-high in 2007 as an expanded B wave at primary degree.
Note the severe oversold condition in the lower momentum panel taking place at the recent bear market lows in 2009. Readings of such magnitude have not occurred since the last cycle degree low way back in 1974. Correlating the depth of these two conditions suits labeling the recent 2009 low as completing all of the Cycle degree A wave.
When we view the current rally from this perspective, we must then consider that the Dow may be only part of the way through a larger bull market at Cycle degree. Following an imminent primary degree B wave bear market decline into the 2012 period, another primary bull market will commence marking primary C of the larger Cycle wave B.
Once this plausible Cycle degree B completes sometime around 2015, the answering Cycle degree C wave decline shall commence. Lasting at least five years through 2020-21, once complete, it would then present us with the earliest opportunity to envision an end to the larger Supercycle IV wave down.
As it has always been, when it comes to forecasting financial markets, the future is wide open. It’s been more than 80-years since we’ve seen a turn pivot of Supercycle dimension. One big difference about forecasting and trading the markets today is that we have just recently witnessed a rare turn pivot at this dimension in either 1999 or 2007. That’s a really big deal.
So what is the recipe for success going forward? It’s quite simply a combination of skill, luck, and persistence. These in our view, are the essential ingredients needed to keep one step ahead of the markets. That said, if you’re attitude is anything like ours, you’re probably thinking…
…Okay Einstein, so how in the hell do you propose I position my funds for what you suggest might unfold in the future? It's all well and good that each of these outcomes is viable, but how in God's name am I supposed to know which one (if any) of these propositions will come about? Do you have some kind of system or something that tells you when to get out of dodge and when to get back in on the long side? What if you're wrong? I've been around the block a few times and remember back in 1995 you Elliott Wave people were saying that we were at the crest of some bear market tidal wave. You were all dead wrong. Instead of a bear market, the Dow more than quadrupled by 1999. How are you going to deal with another profound forecasting disaster of such magnitude?
To answer the above questions in short:
- We suggest positioning ones speculative/investment funds in tandem with an automated rules based trading/investment methodology that has proven to be profitable over varied market cycles.
- No one knows which forecast (if any) will come to fruition. Thus the need for a disciplined strategic methodology that will find the right forecast, and/or correct itself much faster than you can.
- Yes, we employ an automated rules based trading methodology that systematically positions us on the right side of the markets, and gets us out or short before things start getting ugly.
- When our methodology is wrong, it will simply correct itself far in advance of doing any major damage to our account balances and equity curves.
- We are not the same Elliott wave people who forecast the onset of a great bear market in 1995. We are the next generation of Elliott wave. Embracing the discipline of flexibility in forward vision along with applied strategic automation is what sets us apart from most others. As the markets change, so do our forecasts and positions. In our book, price action rules. As such, it is impossible for us to endure a forecasting blunder to the magnitude described.
Using various tenets of Elliott wave, and Fibonacci sequencing, along with proprietary algorithms, the author has developed a near fool proof method by which to trade/invest safely and profitably throughout the course of the current and future market cycles.
These unique automated trading systems have been coded through TradeStation to capture the lion’s share of Elliott waves at three degrees of trend. Additional shorter-term trading systems have also been designed, developed, and tested to successfully engage the markets at much smaller degrees of trend.
Beginning sometime in 2011, the exemplary guidance provided by these robust trading systems may be bundled with a new suite of charting and forecasting services. For those who are neither inclined nor interested in following the detailed charting and forecasting analytics, we will also be making these guidance services available as a standalone options. Click here for a summary of 3, 5, and 10-year performance stats on each of these systems.
We have yet to solidify all of the particulars surrounding our new suite of service options for 2011. So, if you are interested in helping shape the nature and composition of these new ground breaking offerings, or if you are an existing subscriber and wish to have a say in how our new lineup is going take shape, it is VITAL that you get an invite to take our NEW SUITE OF SERVICES survey. If you have not already received one, email us and we'll send one right over.
Wishing each of you a safe, healthy, prosperous, and joyous Holiday Season
By Joseph Russo
Chief Publisher and Technical Analyst
Elliott Wave Technology
Email Author
Copyright © 2010 Elliott Wave Technology. All Rights Reserved.
Joseph Russo, presently the Publisher and Chief Market analyst for Elliott Wave Technology, has been studying Elliott Wave Theory, and the Technical Analysis of Financial Markets since 1991 and currently maintains active member status in the "Market Technicians Association." Joe continues to expand his body of knowledge through the MTA's accredited CMT program.
Joseph Russo Archive |
© 2005-2022 http://www.MarketOracle.co.uk - The Market Oracle is a FREE Daily Financial Markets Analysis & Forecasting online publication.


