


Weekly Gold and Silver Technical Analysis Report - Another Global Financial Markets Collapse?
Commodities / Gold & Silver Oct 21, 2007 - 05:36 PM GMTBy: Merv_Burak

 Are we in for another global market collapse? Good thing we focus here on the precious metals, which are doing just fine so far.
Gold Open Interest (cont.)
Just a couple of additional notes on the gold open interest. As mentioned last week my open interest data only goes back some five years, to 03 Dec 2002 . At that time the open interest stood at 158,433. Over this past five year period, as gold generally trended higher, the open interest also generally trended higher. The increase in open interest during this time was 328,775 contracts representing 32.9 million ounces of gold which at today's price represents $25.3 Billion.
Now, not all of that open interest is short sales but if only half of it is then there's still a hell of a lot of money on the short side represented here. One may assume that someone, somewhere, is holding a huge amount of losses and it ain't you and me.
Another interesting point, although I haven't delved too deeply into it, is the pattern of the open interest. Except for the present period and a very short period in late 2004 the open interest has been trapped in a gentle up trending channel. Most of the time when the open interest declined down to the lower up trending channel line that seems to coincide with a bottom in the gold price. As for the peaks in the open interest, when it advances to the upper trend line there does not seen to be a good correlation with gold price but as mentioned, I have not really looked all that deeply into this. Maybe in a few weeks I'll come back to this topic with further insights into the relationship between gold price and the open interest.
For those who want to learn more about the intrigues behind what may be happening with gold bullion one good starting point would be the Gold Anti-Trust Action Committee web site at www.gata.com . I gave an erroneous web address last week and was unable to correct it on some of the sites posting my commentary. I apologize for any inconvenience that might have caused.
GOLD : LONG TERM
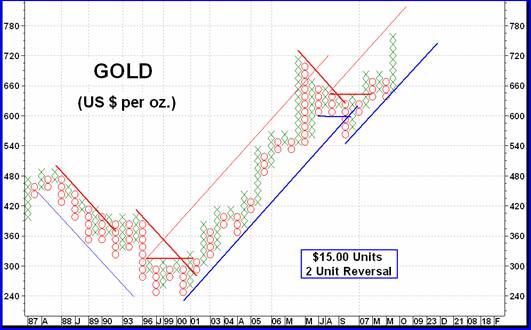
One thing the long term P&F chart does is filter out most of the short term fluctuations in price that tend to confuse the issue of where we are and where we are going. It's not perfect, nothing is, but it does keep one on the right side of the long term trend. On the rare occasion when the market gives it a whip-saw the chart also turns around, although at its own pace (see the $600 bear signal followed by a $660 back to the bull signal. We are still under the influence of that bull as far as the P&F is concerned. The likelihood of a trend reversal on this P&F chart is quite remote for some time. Without any new volatility, up and down, it would take a move to $630 to reverse to a bear. So, the P&F is bullish, let's see what the normal indicators are telling us.
First, gold is well above its long term moving average line and the line slope continues towards the up side. Momentum continues in the positive zone, where it has been ever since first crossing into the positive in Aug of 2001 (except for one very brief period in 2004 when it dropped below its neutral line but quickly recovered). Although the momentum indicator is showing signs of some weakness versus price action this weakness is nothing to worry about at this time but one should keep it in mind. The volume indicator has finally exceeded its previous high set last April. Nothing in the long term indicators to suggest we are anything but BULLISH.
INTERMEDIATE TERM
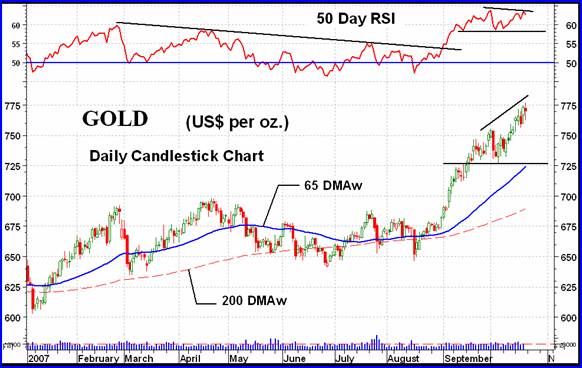
We know that the intermediate term will look great after the upside action over the past few weeks, but let's look a little deeper into the indicators. First, we have indicated supports in both the price and momentum. These are shown on the chart. As far as the moving average is concerned, nothing out of the ordinary here. It is moving nicely in an upward direction. As for the momentum itself, that's starting to be a problem. Although in the positive zone the weakness in the momentum is becoming quite noticeable.
Note the potential negative divergence between the lower momentum versus higher price. I call it a “potential” as it becomes confirmed only after the price has reversed creating a peak while the momentum remains below its previous level. It's quite possible at this time that the price could continue higher with the momentum also making a new high. Again, something to keep your eye on but at this time it is still not a done deal, only a concern. As for the volume action, over the past couple of weeks the volume indicator (the On-Balance Volume) has shown a steady accumulation of upside volume BUT on a daily basis I would consider the volume action somewhat neutral, not that great but not too shabby either. All in all the intermediate term is still rated as BULLISH.
SHORT TERM
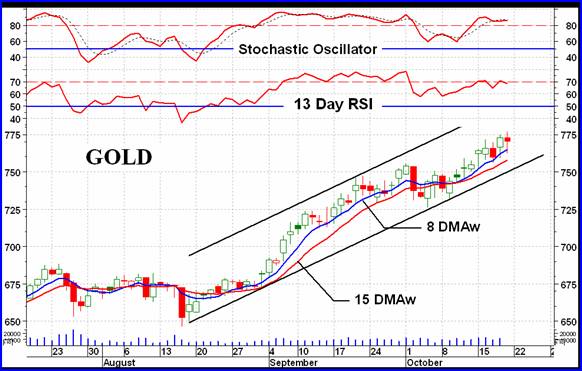
A couple of times it looked like the trend was ready to turn on us but after a few short days it gets back to the up side. A good example of staying with a trend until its reversal is confirmed. The slope of the short term moving average line stayed on the positive side since last turning up in late Aug. We now have an up trending channel as another guide for remaining in a positive mood. As with the intermediate term we are getting vibes from the short term momentum indicator that the recent price action is getting weaker and weaker.
The non-confirmation of new price highs (potential negative divergence) is seen here as in the intermediate term. The short term momentum continues to skirt its overbought line while the more aggressive Stochastic Oscillator continues inside its overbought zone. The first hint of possible trouble with the price might come with a drop in the Oscillator below its overbought line. In the mean time stay with the trend, which remains bullish on the short term.
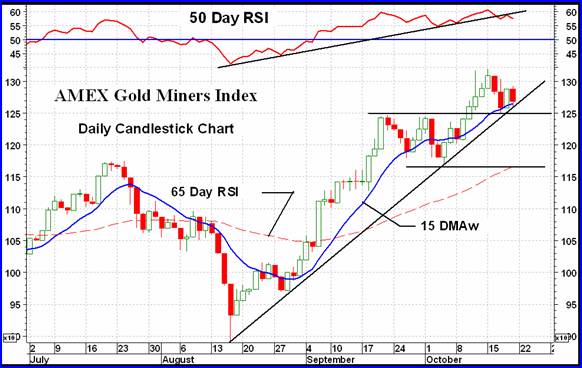
NORTH AMERICAN GOLD INDICES
I've shown a short term chart of the AMEX Gold Miners Index (on the next page) due to the precarious potential position it is at. The Index is sitting on top of its intermediate term up trend line, just above its short term moving average line and almost on top of a fairly good support. Most worrying is the trend of the intermediate term momentum indicator. Very often we get better trend lines on the momentum indicators than the price or Index itself. Here, we already have the trend line broken, suggesting weakness in the latest price action. Is the Index next?
Should the Index drop below support it could quite quickly move down to the next support, which is also the level of the previous rally high from July. If it goes through that support then in all likelihood we could expect a test of the previous Aug low.
Although the intermediate and long term ratings for the five rotating North American Indices are BULLISH the short term ratings are starting to show the weakness with some downgrades in ratings.
MERV'S PRECIOUS METALS INDICES
Although gold closed higher on the week by 2.1% this did nothing for the universe of precious metal stocks. They all closed lower, as did the major Indices. The overall Composite Index also closed lower, by 1.8%. This, however, changed nothing from the stand point of ratings, the Composite is still BULLISH for both the intermediate and long term.
MERV'S GOLD & SILVER 160 INDEX
The universe of 160 precious metal stocks closed the week with a decline of 2.2%. Nothing serious and no indicators or ratings were changed as a result. There were 46 stocks on the up side (29%) and 108 on the down side (68%), better than two to one on the down side. The summation of individual ratings moved slightly towards the negative but except for the short term were almost unnoticeable from last week. Despite some volatile action during the week there were no stocks in the plus/minus 30% category at the end of the week. In fact there were none even in the plus/minus 20% category.
Looking at the chart and indicators nothing has changed from last week. I still rate both the intermediate and long term as BULLISH.
MERV'S QUAL-GOLD INDEX : MERV'S SPEC-GOLD INDEX : MERV'S GAMB-GOLD INDEX
There was no discernable pattern in the actions of these three sector Indices. They all declined on the week. It seems that the secondary stocks were the least out of favor with the Spec-Gold Index losing only 0.7% and with the best win/loss numbers at 13 winners and 16 losers. The Qual-Gold Index lost 2.6% with 8 winners and 22 losers while the Gamb-Gold Index lost 4.6% and had only 6 winners and 24 losers. As with the 160 Index, the summation of individual stock ratings changed very little, other than in the short term.
Looking at the chart and indicators nothing has changed from last week. I still rate both the intermediate and long term as BULLISH.
SILVER
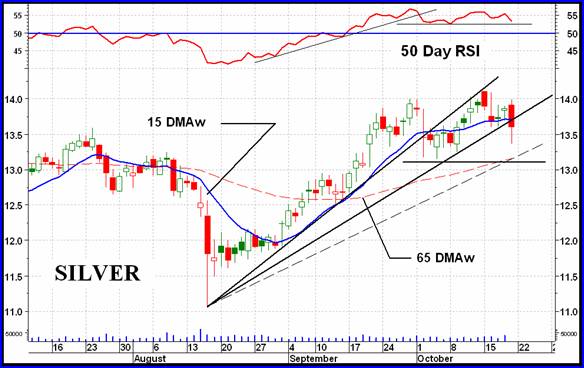
Whereas gold closed higher on the week silver went in the other direction. Silver closed down by 2.2% (gold closed up by 2.1%). After a good Aug and Sept, for the past month silver seems to be making a topping pattern. It can't seem to get any further ahead while the momentum indicator continues to get weaker. Volume had never shown any real strength, even during the advance. The stage seems to be set for a serious new decline. Should silver close at $13.00 or below (on the Dec 2007 contract) then that would probably confirm a decline in motion.
A move to $13.00 would also break below a theoretical third FAN trend line. From this I would not be surprised if the action halted above the support line for a few days before breaking below. That would confirm a third FAN trend line, but this is only guesswork. What is not guesswork is that silver is showing serious signs of wanting to get back into the down side.
MERV'S QUAL-SILVER INDEX : MERV'S SPEC-SILVER INDEX
Relative to their gold counterparts the declines in the silver Indices have been slightly greater. The Qual-Silver Index closed down by 2.9% while the Spec-Silver Index closed down by 1.5%. While the Qual-Gold Index is still well above its previous 2007 highs the Qual-Silver Index is well below. On the Spec side the gold Index is at its yearly high level while the Spec-Silver is still significantly below. This is not the yet time to be looking at silver stocks for investment or speculation.
Merv's Precious Metals Indices Table
Time to call it another week.
For DAILY Uranium stock commentary and WEEKLY Uranium market update check out my new Technically Uranium with Merv blog at www.techuranium.blogspot.com .
By Merv Burak, CMT
Hudson Aero/Systems Inc.
Technical Information Group
for Merv's Precious Metals Central
Web: www.themarkettraders.com
e-mail: merv@themarkettraders.com
During the day Merv practices his engineering profession as a Consulting Aerospace Engineer. Once the sun goes down and night descends upon the earth Merv dons his other hat as a Chartered Market Technician ( CMT ) and tries to decipher what's going on in the securities markets. As an underground surveyor in the gold mines of Canada 's Northwest Territories in his youth, Merv has a soft spot for the gold industry and has developed several Gold Indices reflecting different aspects of the industry. As a basically lazy individual Merv's driving focus is to KEEP IT SIMPLE .
To find out more about Merv's various Gold Indices and component stocks, please visit www.themarkettraders.com and click on Merv's Precious Metals Central . There you will find samples of the Indices and their component stocks plus other publications of interest to gold investors. While at the themarkettraders.com web site please take the time to check out the Energy Central site and the various Merv's Energy Tables for the most comprehensive survey of energy stocks on the internet. Before you invest, Always check your market timing with a Qualified Professional Market Technician
Merv Burak Archive |
© 2005-2022 http://www.MarketOracle.co.uk - The Market Oracle is a FREE Daily Financial Markets Analysis & Forecasting online publication.
Comments
|
jahangir
09 Dec 07, 07:07 |
silver future trend
hi, silver is standing on a resistance level , it will go upward or downwards ,what trends are possible at present. |