


Stock Market Cycle Turning Points Analysis - Current Trend is Corrective
Stock-Markets / US Stock Markets Oct 21, 2007 - 06:08 PM GMTBy: Andre_Gratian

 Current Position of the Market.
SPX: Long-Term Trend - The 12-yr cycle is approaching its mid-point and some of its dominant components are topping and should soon restrain the bullish effect of the 4.5-yr. This could lead to another period of consolidation in 2008 with an eventual bull market top in 2009-2010.
SPX: Intermediate Trend - The intermediate-term trend has been up since the 4.5yr cycle low in August, but it must get the 12-mo cycle out of the way before it can resume.
Analysis of the short-term trend is done on a daily basis with the help of hourly charts. It is an important adjunct to the analysis of daily and weekly charts which determines the course of longer market trends.
Daily market analysis of the short term trend is reserved for subscribers. If you would like to sign up for a FREE 4-week trial period of daily comments, please let me know at ajg@cybertrails.com .
Overview
The short-term top that was suggested by the loss of upward momentum to which I referred two weeks ago, turned into a nasty affair with the Dow losing 366 points last Friday alone, the wellpublicized 20th year anniversary of 1987's "Black Monday". Friday's loss represented half of the total correction from its 14198 top 7 trading days ago. The SPX was also down 40 points on Friday and all other indices had similar declines.
The question which is now on everyone's mind is whether this will turn out to be a genuine "crash" with a big follow through on Monday, or simply an overdue healthy correction to the nearly straight up move which started on 8/16. "History never repeats itself; but it often rhymes" , Mark Twain once said, so perhaps any similarity to 1987 will be short-lived!
This is what the next few days will decide and what we will endeavor to determine in the sections that follow.
What's Ahead?
Momentum:
In the last newsletter I pointed out the loss of upward momentum displayed by the indicators, and the bearish volume pattern. The SPX had not yet made a new all-time high. It went on to do so, but a few days later started to reverse. That reversal has developed into a full-scale decline exacerbated by the seasonal tendencies and the psychological mind set associated with the "7th year" of the decennial pattern syndrome, although October 1997, by contrast, was a non-event, bringing about only a 40-point pull-back in the long-term uptrend.
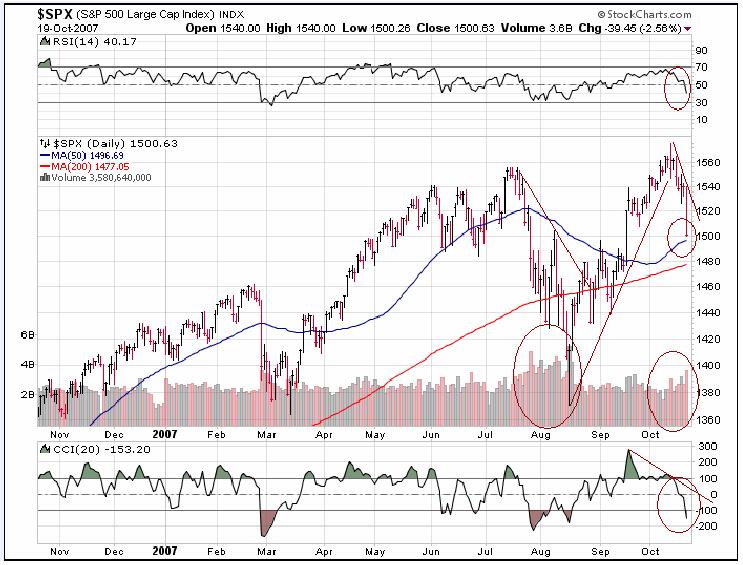
What does the chart that follows (courtesy of StockCharts) tell us? Only that the correction does not appear complete and may have a few more days to run. There is no price or indicator deceleration, yet. This would require a rally followed by another decline. The volume pattern is not excessive, and more similar to that of the March correction that to the 8/16 decline.
Both moving averages are still in an uptrend and may provide some support in conjunction with price support levels which exist in the 1480 area. This is where the SPX is most likely to make its low, and this could come as early as next week.
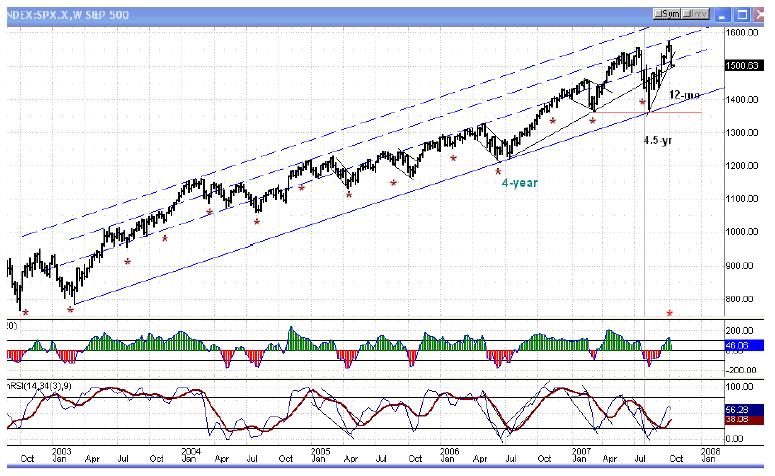
The following chart of the weekly SPX gives us a picture of the long-term uptrend. The index is trading in a well-established channel with multiple areas of support and resistance. The second parallel from the top has now asserted itself as an important resistance line, repelling advances a number of times, including the recent new all-time high at 1576 by the SPX.
In spite of last week's sharp decline, the index does not seem ready for a major reversal at this point, and it could very well make a new high before this happens. Although the lower indicators showed some negative divergence at the top, their pattern and the price pattern only point to a temporary correction at this time . The next rally could tell a different story. The next few weeks will clarify what is really taking place but for now, this is what I see. I'll discuss my reasons in more detail under Cycles and Projections .
Cycles
This is an excerpt from the last newsletter: We are in a time period which has caused some analysts to predict a "crash" during the month of October based on the 7th year of the decennial pattern. Instead, some of the indices have moved to new highs. With the 4.5-yr cycle bottoming in August, the long-term cycle configuration does not look capable of supporting a crash scenario. But it is possible that the 12-mo cycle bottom is still ahead of us and could cause a shortterm decline. Historically, this cycle has made its low in the September-November time frame. With a number of technical indicators suggesting that a short-term top may be near, it is probably best to assume that the 12-mo low is still ahead.
And indeed it was and produced a noteworthy decline! Semantics (and the days ahead) will determine whether this (was) is a "crash" or just a strong correction, and it will depend on how much more downward pressure is left from the 12-mo cycle. Since the past week was 10 weeks from the last 20-wk cycle low of 8/6, I have been looking for signs that the 10-wk cycle has made its low, but this remains unclear . This cycle has bottomed a few days late on a number of occasions and we are still within the time frame of its normal phase. Assisted by the 12-mo cycle which is also in its hard down phase and which may still have a few days to go, the combined pressure of the two cycles could easily have produced the sharp correction of the past few days.
If we assume that this is the "real" cause of the decline, then we should now see a rally followed by another and final decline, with the whole affair possibly being over by the middle of next week. An extension to early November is also possible with a final low in conjunction with some short-term cycles due at that time.
There is, by necessity, a certain amount of guesswork in determining the exact low of a cycle. But this can often be made more precise by looking for projections which fit the scenario. This is what we will do in the next section.
While the recent high of 1576 on the SPX could turn out to be the top of the uptrend from 8/16 and the beginning of an extended intermediate correction, the seasonal and gravitational bias is positive until January '08. After the 12-mo cycle has bottomed, another rally is expected to occur and last into the end of the year or early next, after which there would be a more prolonged decline into 2008 as the 2-yr and 6-yr cycles make their lows.
Projections
Also from the last newsletter: When the SPX moves decisively above its former high, it will trigger Fibonacci projections into the 1600s. Near-term, there are two (Fibonacci and Point & Figure) targets which lie directly ahead. The first, 1560-1565, was reached on Friday. The other is 1580-1585.
The SPX only made it to 1576, 4 points short of its minimum target before rolling over. The fact that the 1580-85 target had several Point & Figure counts, and that the 10-wk cycle was expected to make its low last week, made it almost mandatory to be cautious about calling 1576 the top. But after Wednesday's strong opening quickly fizzled, it became more likely that the index was not likely to go higher before some additional correction.
1508 should have been a strong line of defense for the bulls, but since it was broken, they will be forced to regroup at a more substantial support area between 1480 and 1490. Breaking below 1508 triggered a Fibonacci projection to about 1482, and I can also come up with some P&F counts to about 1480. This is the level that deserves to be watched for a correction low, especially since it is also a strong support level.
Breadth
The NYSE McClellan oscillator had remained positive for seven weeks but, as stated a couple of weeks ago, "the negative divergence which is showing in the McClellan oscillator is of concern for the immediate future." The index remains in a downtrend but could bottom at any time.
The pattern of the last few days has caused the NYSE Summation Index to enjoy its first correction since the 8/16 low. Typically, there is more than one with a display of negative divergence to price before an important high is achieved.
For a short-term low to be reached, the hourly A/D must shrink significantly from its previous day while price makes a lower low. This is what we will be watching for on Monday.
Market Leaders & Sentiment
Of our two favorite leading indicators, GE did follow the SPX to new correction lows but, like the SPX, so far this appears to be a normal correction within its long term channel, so it is not a sign that an important top is in the offing, here.
By contrast, there is plenty of positive divergence left in the NDX when compared to the SPX. On Friday, in pre-opening trading, the futures nearly made a new high before correcting with the rest of the indices. Historically, this implies that we have not yet reached an important top and that there are higher highs ahead for the SPX.
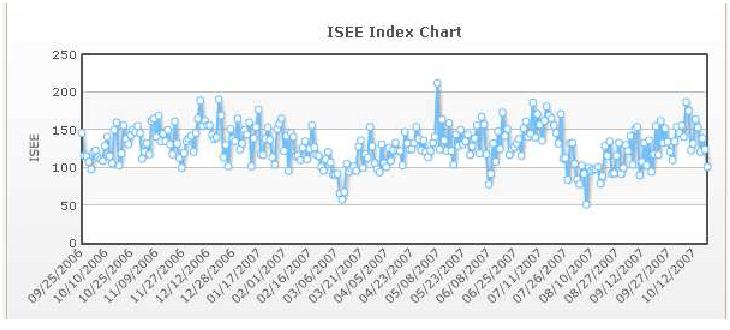
From its low of 8/16, the ISEE (put/call ratio indicator) rose steadily to a high point associated with short-term tops in mid-October, thereby suggesting that a correction was needed. It has now retraced to an area which is only slightly positive.
Summary
The SPX peaked just ahead of its 10-week and 12-mo cycle low. The combined pressure of these two cycles has resulted in a sharp decline which had its biggest impact last Friday.
While the low of the correction has probably not yet arrived, the bulk of the decline is probably behind us with next week being a likely time frame for its low point.
A market advisory service should be evaluated on the basis of its forecasting accuracy and cost. This service is probably the best all-around value. Two areas of analysis that are unmatched anywhere else -- cycles and coordinated Point & Figure and Fibonacci projections -- are combined with other methodologies to bring you weekly reports and frequent daily updates.
The following are examples of unsolicited subscriber comments:
What is most impressive about your service is that you provide constant communication with your subscribers. I would highly recommend your service to traders. D.A.
Andre, You did it again! Like reading the book before watching the movie! B.F.
I would like to thank you so much for all your updates / newsletters. as i am mostly a short-term trader, your work has been so helpful to me as i know exactly when to get in and out of positions. i am so glad i decided to subscribe to turning points. that was one of the best things i did ! please rest assured i shall continue being with turning points for a long while to come. thanks once again ! D.P.
But don't take their word for it! Find out for yourself with a FREE 4-week trial. Send an email to ajg@cybertrails.com .
By Andre Gratian
MarketTurningPoints.com
A market advisory service should be evaluated on the basis of its forecasting accuracy and cost. At $25.00 per month, this service is probably the best all-around value. Two areas of analysis that are unmatched anywhere else -- cycles (from 2.5-wk to 18-years and longer) and accurate, coordinated Point & Figure and Fibonacci projections -- are combined with other methodologies to bring you weekly reports and frequent daily updates.
“By the Law of Periodical Repetition, everything which has happened once must happen again, and again, and again -- and not capriciously, but at regular periods, and each thing in its own period, not another’s, and each obeying its own law … The same Nature which delights in periodical repetition in the sky is the Nature which orders the affairs of the earth. Let us not underrate the value of that hint.” -- Mark Twain
You may also want to visit the Market Turning Points website to familiarize yourself with my philosophy and strategy.www.marketurningpoints.com
Disclaimer - The above comments about the financial markets are based purely on what I consider to be sound technical analysis principles uncompromised by fundamental considerations. They represent my own opinion and are not meant to be construed as trading or investment advice, but are offered as an analytical point of view which might be of interest to those who follow stock market cycles and technical analysis.
Andre Gratian Archive |
© 2005-2022 http://www.MarketOracle.co.uk - The Market Oracle is a FREE Daily Financial Markets Analysis & Forecasting online publication.