Stock Market Reaches Eight Month High, Could be Downhill Fast
Stock-Markets / Stock Markets 2010 Dec 26, 2010 - 06:31 AM GMT After Nearly Two Years Of Searching, TrimTabs Still Can't Figure Out Who Is Buying Stocks
(ZeroHedge) A year after Charles Biderman's provocative post first appeared on Zero Hedge, in which he asked just who is doing all the buying of stocks as the money was obviously not coming from retail investors, today Maria Bartiromo invited the TrimTabs head once again in an interview which disclosed that after more than a year of searching, Biderman still has no idea who actually buying. In response to Bartiromo's question if the retail investor, who left after the flash crash (thank you SEC), Biderman responds what every Zero Hedger has known for 33 weeks: "Retail investors are not coming back to the US…When I was on your show a year ago I was saying the same thing: we can't figure out who is doing the buying it has to be the government, and people said I was nuts. Now the government is admitting it is rigging the market." Cue Bartiromo’s jaw dropping.
Emerging Equity Funds Post First Outflows Since May
(Bloomberg) Emerging-market equity funds posted the first net withdrawals since May in the week ended Dec. 22 amid concern China will continue tightening monetary policy, trimming a record-setting year for inflows, EPFR Global said.
For the year, emerging-market stock funds have taken in a record $92.5 billion and bond funds investing in developing economies had inflows of $52.5 billion, nearly seven times their previous annual inflows on record.
VIX made an extended 8-month cycle low.
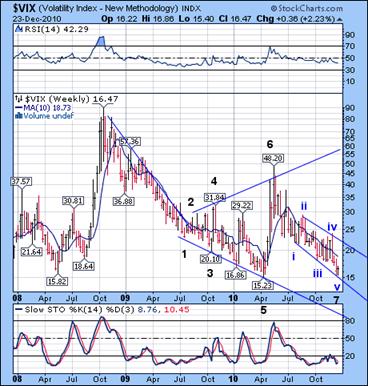 --The VIX extended its 8-month cycle low by two weeks and the possible terminus of point 7 of a one-and-a-half year Orthodox Broadening Bottom. The reasons I have concluded that are (1) In an Orthodox Broadening Formation point 7 cannot exceed point 5. (2) Wednesday’s low matches the Pivot date for a slightly extended 8-month cycle low. (3) There were some gaps in April at 16.71-17.07 and 17.53-17.94 that were left unfilled until Friday.
A descending Broadening Wedge is a continuation pattern that suggests a move at least as long as the prior one from this terminus. Just as VIX gapped up several times in April, we may expect opening gaps as early as Monday.
.SPX reaches its 8-month cycle high.
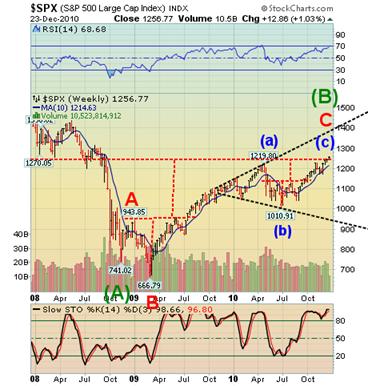 I have been discussing the Pivots on December 13 and December 20 as possible Cycle highs. However, the 8-month cycle had its own schedule. It is probable that Wednesday, December 23rd was the 8-month Cycle High. The elapsed time from the April 26th high to December 23rd was 241 days (high-to-high). The lesser cycles (Pivots) often truncate or extend to meet the 8-month Cycles. The July 1 low was 241 days from the November 1, 2009 low. This is the first completely inverted cycle that I have seen in over 20 years of charting. This inversion completed two inverted Head & Shoulders patterns whose targets were 1245-1247.
The NDX is also at a cycle top.
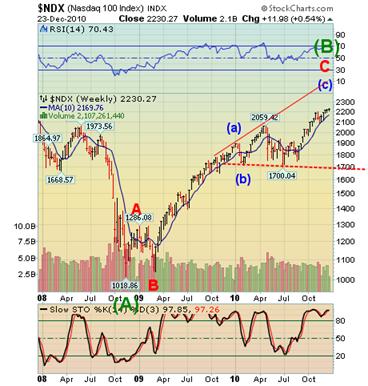 --The NDX closed under its Cycle Top Resistance at 2232.00 after venturing as high as 2238.92 on Tuesday. This kind of action may be considered an aggressive sell signal from the cycle high.
Many NASDAQ followers are suggesting that this may be the beginning to a new bull market. If this week’s action brings the NDX over 2239.23 (2007 high), I might think twice about disagreeing. It sure looks like five waves, doesn’t it? However, there are major differences with the SPX in wave structure. A closer examination yields zig-zag formations pervading the entire complex from the November 2007 high. This is a wave (B) in drag.
Gold appears ready to drop through supports.
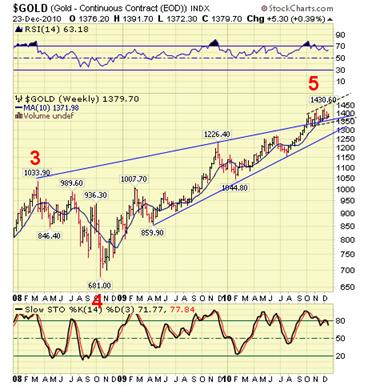 -- Gold declined down from its Weekly Cyclical Top Resistance at 1434.26 as it also completed a weekly reversal pattern. It now appears ready to break below its diagonal pattern and small Broadening Formation at 1355, which may trigger an average 20% decline to 1085.00. There is a combination Trading Cycle and Primary Cycle low due January 17-25. Combination cycle lows are usually stronger than average, so the decline may also be deeper than projected.
$WTIC rise makes OPEC, importers wary.
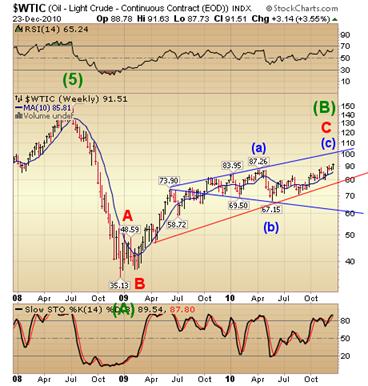 -- $WTIC passed $91.00 in the final throes of a triple zig-zag from its August 27 low. I cannot rule out a spike to 100, but crude oil has been closely following the equities cycle. A drop below 90.00 may trigger a Cycle Top sell signal.
Oil importers are growing wary of the impact of prices near two-year highs as some OPEC members foresee a further rally to the $100-a-barrel level and Arab oil ministers gather for a meeting in Cairo.
Japan’s economy minister said today the government needs to keep an eye on climbing prices while the deputy governor of the Chinese central bank said inflation pressures are rising.
The Bank Index challenged its declining trendline.
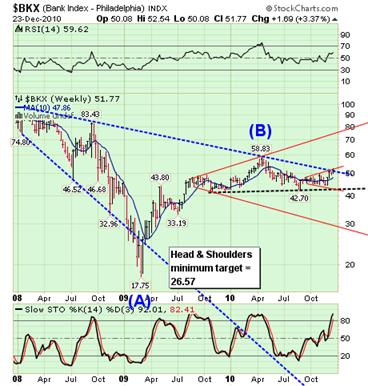 --The $BKX challenged its declining trendline at the 61.8% retracement of the decline from its April high on Wednesday and formed a probable right shoulder to a massive Head and Shoulders pattern. It happened on the 246th day from its top on April 21st. The eight month cycle strikes again?
Is the similarity between the BKX and WTIC just a coincidence, or do we have a correlation here? I see ZeroHedge reporting on JPM cornering the silver market. Goldman Sachs has always had a large position in energy. Hmmm.
The Shanghai Index is still (barely) climbing its trendline.
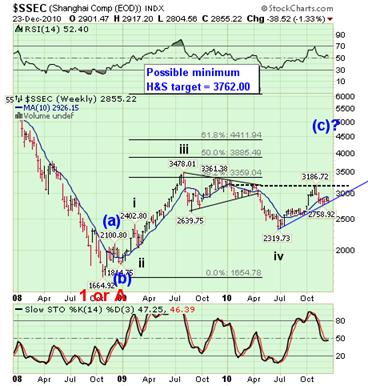 --The Shanghai Index dropped to its trendline at 2835.16 today. Although I have a bullish view in the short term, a drop below today’s level may change that perspective.
China’s government failed to draw enough demand at a bill sale for the second time in a month as seasonal demand for funds and higher reserve-requirement ratios left banks with less cash. The finance ministry sold 16.76 billion yuan ($2.53 billion) of 91-day securities, falling short of the planned 20 billion yuan target, according to a statement on the website of Chinabond, the nation’s biggest debt-clearing house. The average winning yield was 3.68 percent, higher than the 3.22 percent rate for similar-maturity debt in the secondary market yesterday.
$USB reversed within its declining Broadening Wedge.
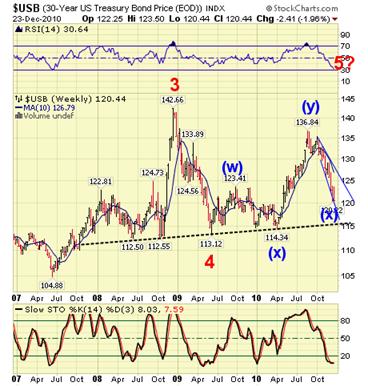 -- $USB appears to have made a deep retracement of the rise from its extended 8-month cycle low. It is still within its descending Broadening Wedge, which is a continuation formation. The 8-month cycle appears to be governing virtually all assets to one extent or another. It appears that USB has averted a major crash for now and may embark on a rally that has the potential to make new highs.
Treasury 10-year note yields rose for a fourth week, the longest stretch of gains in 19 months, as reports showing the economy expanded, consumer spending advanced and orders for capital goods increased bolstered speculation the recovery is gathering momentum.
$USD consolidates before its breakout.
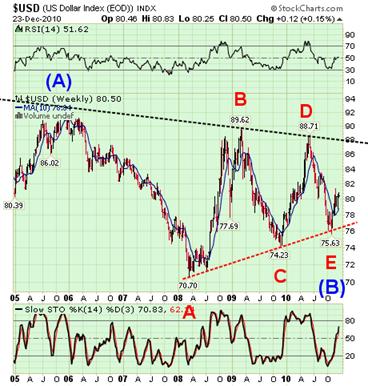 -- $USD appears ready to break out above its November high. The wave pattern shows an impulse from its low, followed by a 50% zig-zag retracement. The next wave will most likely be a third wave. The next move may have a target of 88.23, potentially launching it above the waiting top trendline.
The U.S. dollar turned lower against the euro on Thursday, and extended losses against the Japanese yen, as movements by the Swiss franc supported the European single currency. Still, the euro stayed in a tight range in quiet, pre-holiday trading, with the dollar heading toward a weekly gain against the single currency that will add to its rise in 2010.
Traders alert: The Practical Investor is currently offering the daily Inner Circle Newsletter to new subscribers. Contact us at tpi@thepracticalinvestor.com for a free sample newsletter and subscription information.
Our Investment Advisor Registration is on the Web
We are in the process of updating our website at www.thepracticalinvestor.com to have more information on our services. Log on and click on Advisor Registration to get more details.
If you are a client or wish to become one, please make an appointment to discuss our investment strategies by calling Connie or Tony at (517) 699-1554, ext 10 or 11. Or e-mail us at tpi@thepracticalinvestor.com .
Anthony M. Cherniawski, President and CIO http://www.thepracticalinvestor.com
As a State Registered Investment Advisor, The Practical Investor (TPI) manages private client investment portfolios using a proprietary investment strategy created by Chief Investment Officer Tony Cherniawski. Throughout 2000-01, when many investors felt the pain of double digit market losses, TPI successfully navigated the choppy investment waters, creating a profit for our private investment clients. With a focus on preserving assets and capitalizing on opportunities, TPI clients benefited greatly from the TPI strategies, allowing them to stay on track with their life goals
Disclaimer: The content in this article is written for educational and informational purposes only. There is no offer or recommendation to buy or sell any security and no information contained here should be interpreted or construed as investment advice. Do you own due diligence as the information in this article is the opinion of Anthony M. Cherniawski and subject to change without notice.
Anthony M. Cherniawski Archive |
© 2005-2022 http://www.MarketOracle.co.uk - The Market Oracle is a FREE Daily Financial Markets Analysis & Forecasting online publication.


